
In Part 1 of this series we created a Databricks Community Account and cluster.
In Part 2 we captured some streaming data to a file on our Databricks cluster.
In Part 3 we will look at interacting with the data using structured streaming.
- Using the Databricks cluster created in the previous post
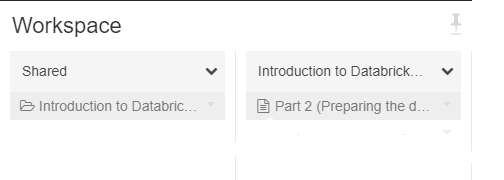
- Navigate to "Introduction to Databricks Structured Streaming" where we should have the notebook from Part 2.
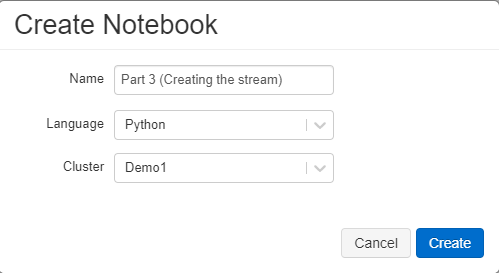
- Create a Python notebook called "Part 3 (Creating the stream)"
- Enter the following code into the cmd pane of the notebook. These are the variables that we will use for the schema for the json data and the location where we stored the files.
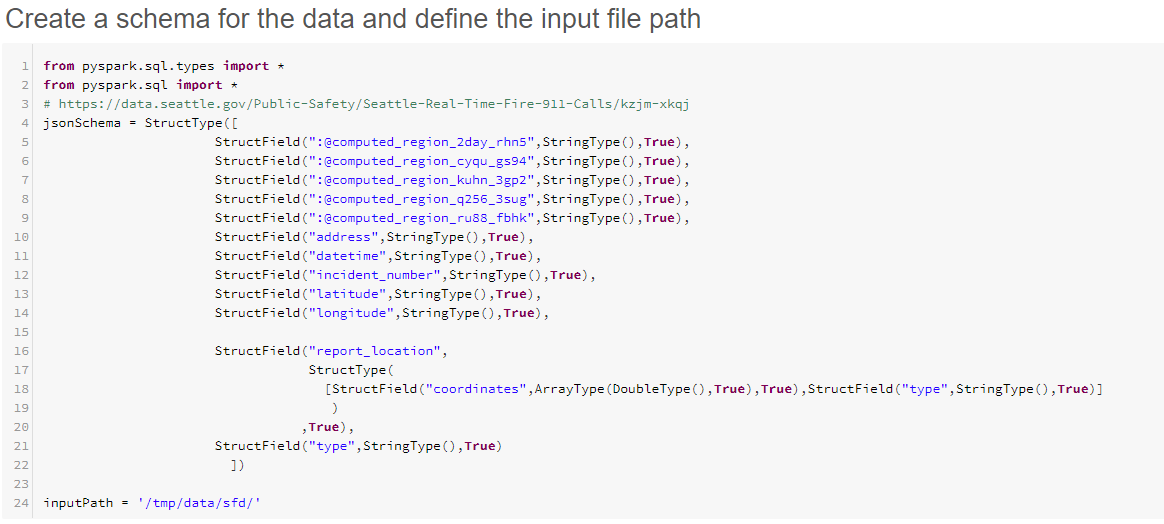
- The Schema for the json can be found on the website Seattle Real Time Fire 911 Calls, however this does not contain all of the columns that are in the api. This is then converted to a Pyspark Struct, the following information may be of use Microsoft.Spark.Sql.Types Namespace
- Get the URL for the data stream and paste it where <URL> is above, this can be found from the API button on the following web page: https://data.seattle.gov/Public-Safety/Seattle-Real-Time-Fire-911-Calls/upug-ckch
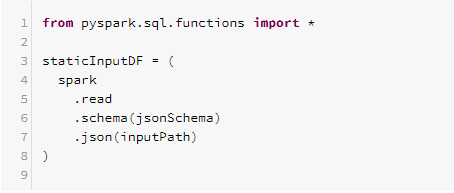
- Add another cmd pane by clicking on the + that appears below the middle of the previous one and add the following code. This reads the files from the file location (inputPath) using the schema (jsonSchema)
- Run both of the panes above click the
 at the top of the notebook or run each cell individually using the play button in the top right. The second pane should return
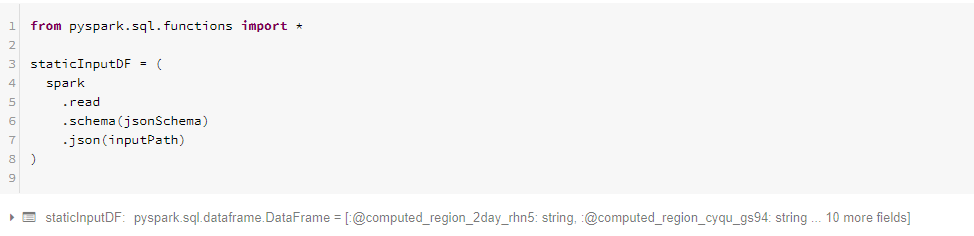
- Click on the arrow to expand the results and you will see the following:
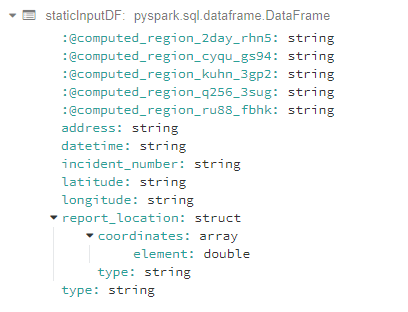
- This shows that a DataFrame has been created but we cannot see any content.
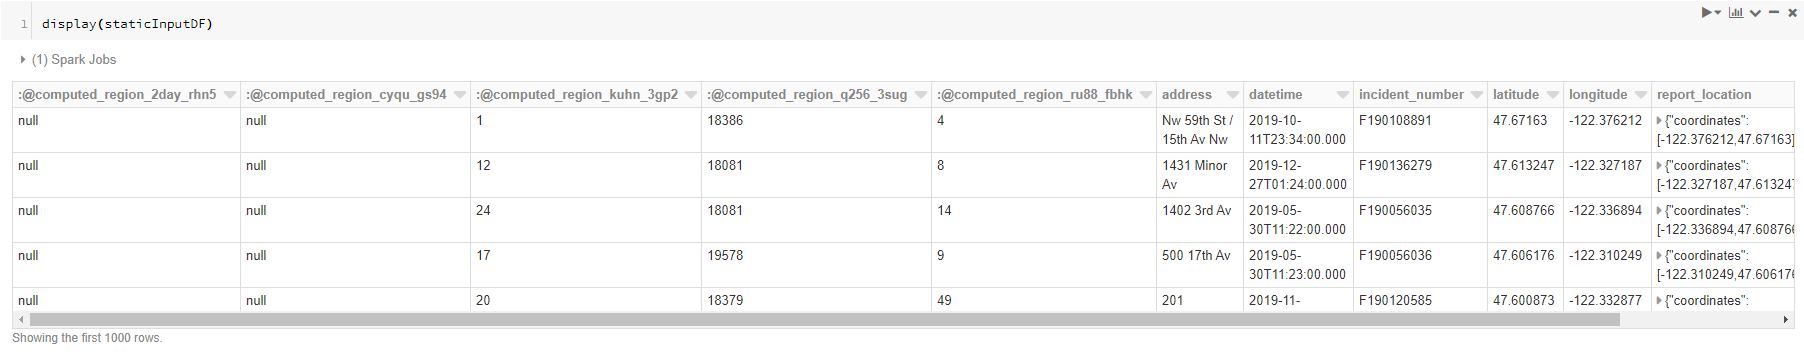
- Add another cmd pane and add the following code, then run the cmd
- The first 1000 lines of the results are shown
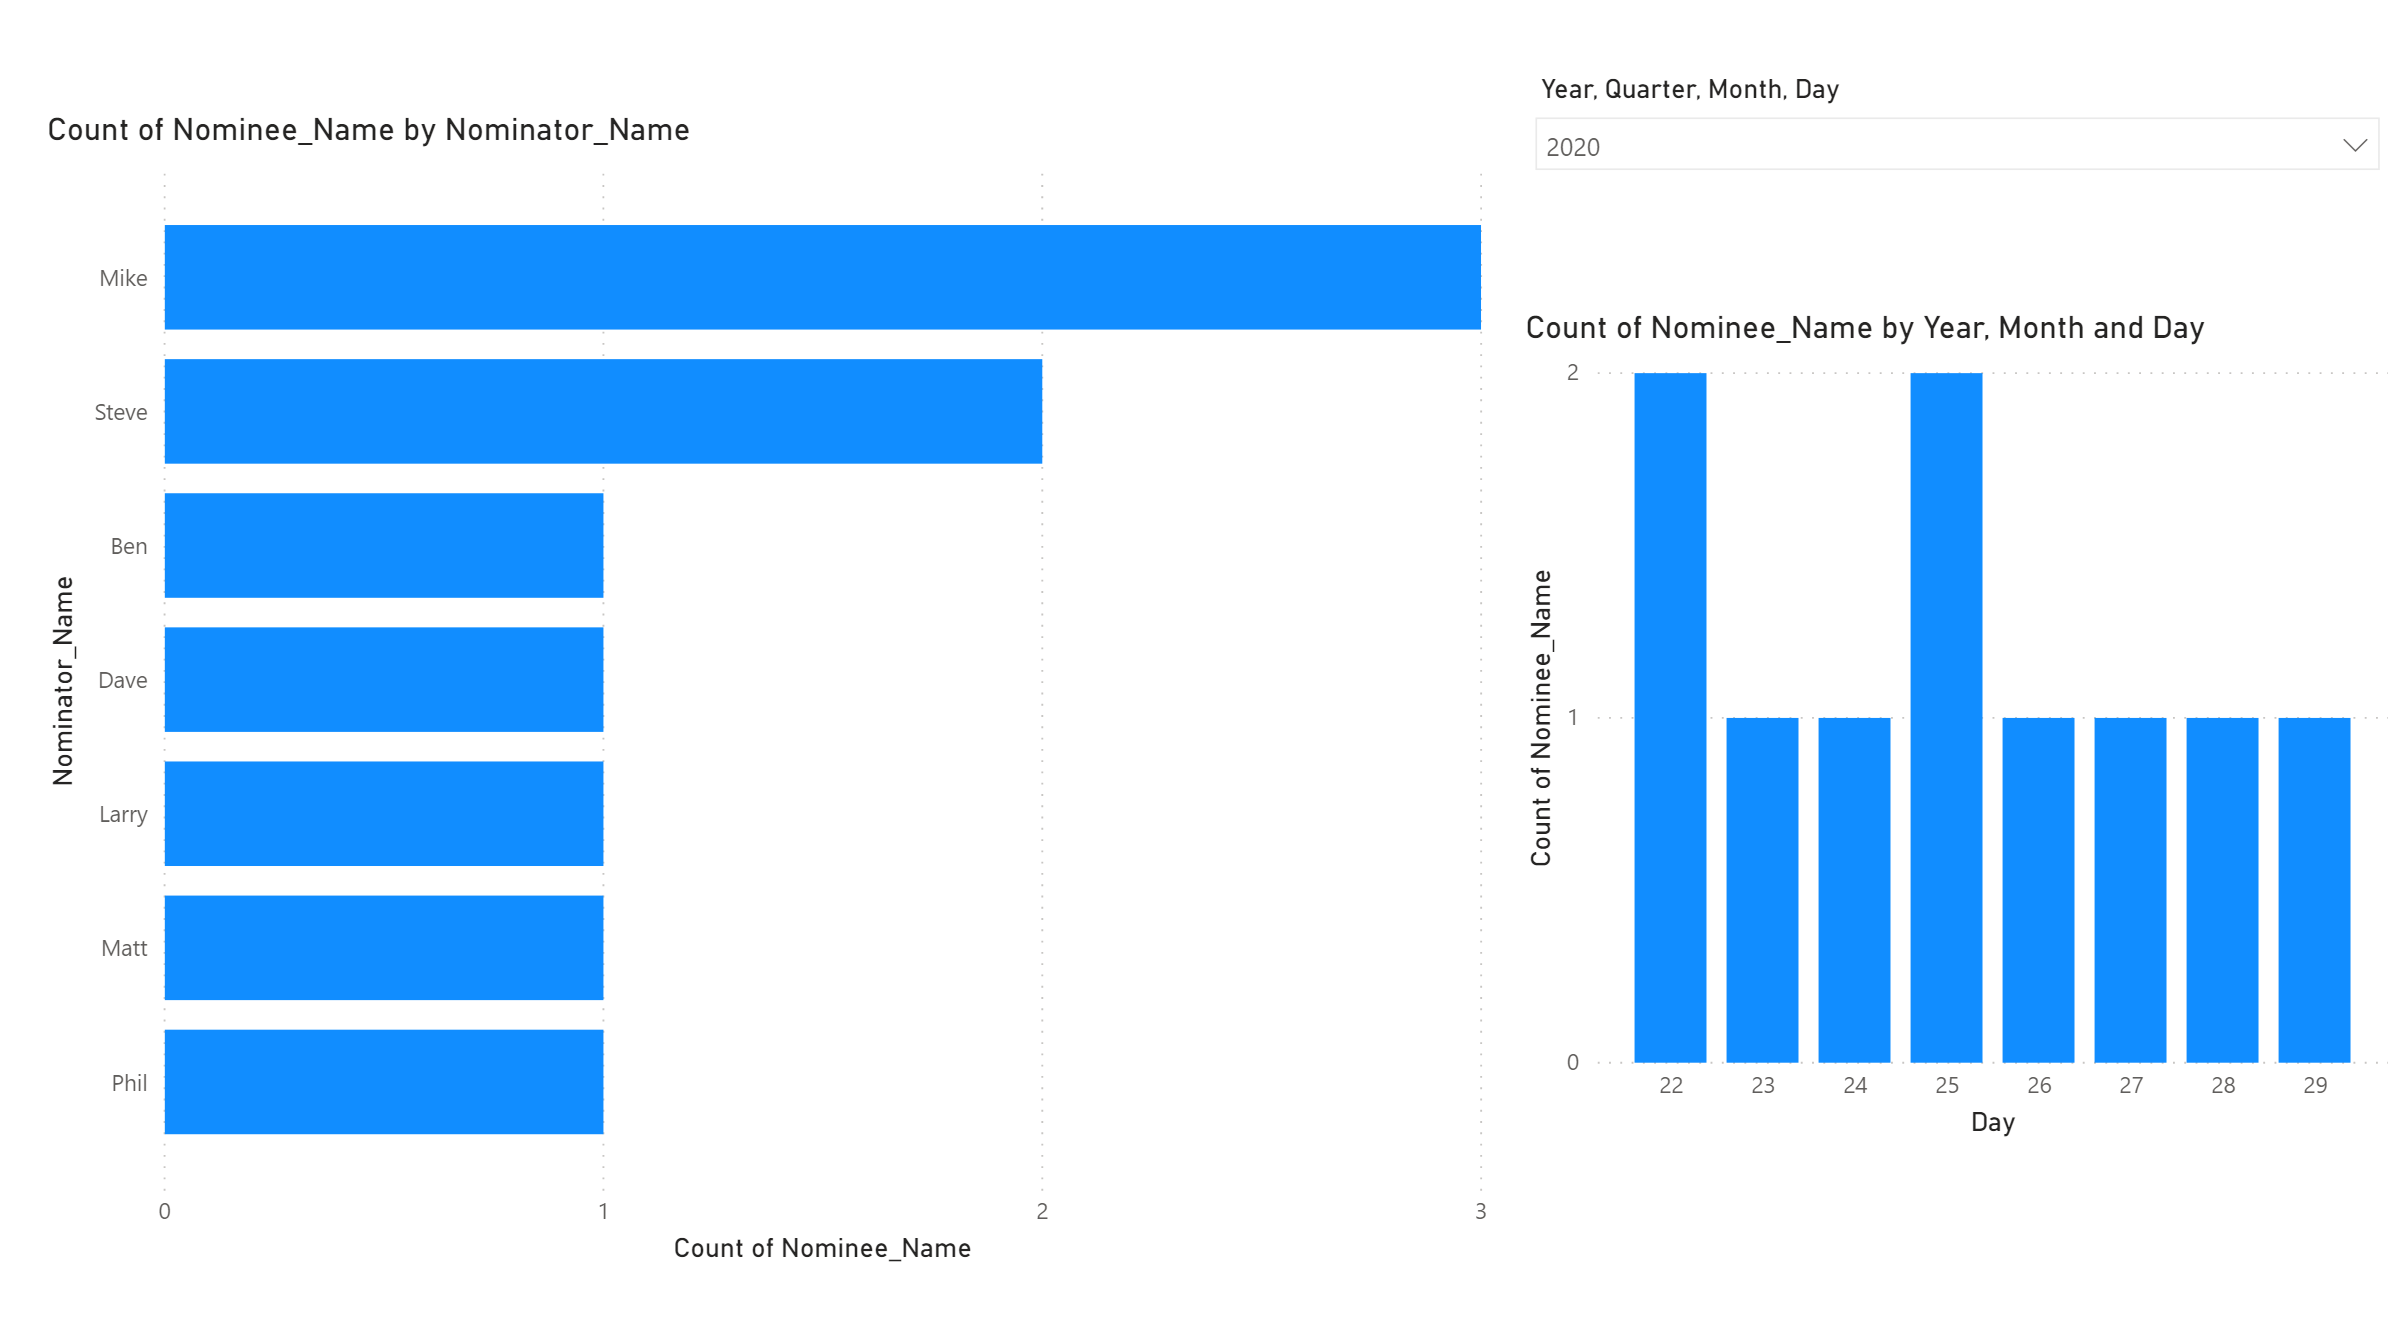
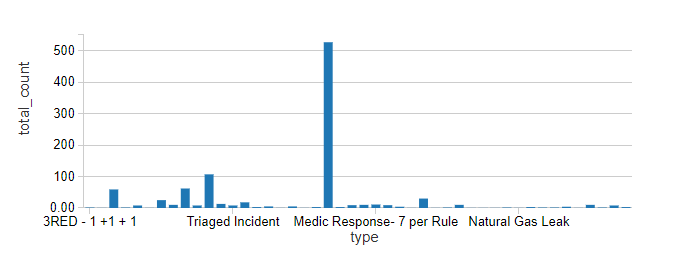
- We have some data and now we would like see what the most frequent call type is, for this we need to aggregate the data by Type.
- Add another cmd cell and call it "Static aggregation", and add the following code:
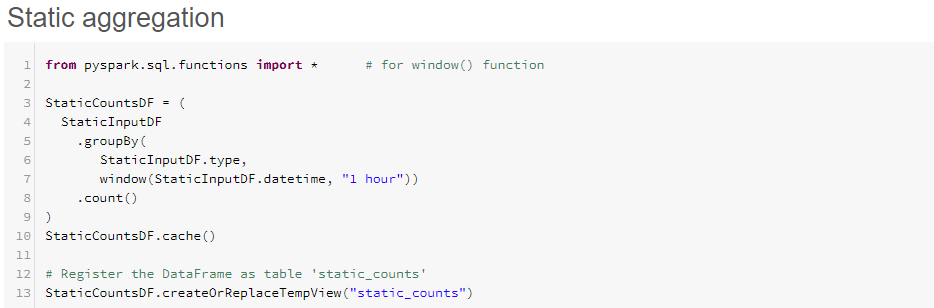
- Run the code above to generate the dataframe "StaticCountsDF"
- Note the last line of the code registers a Temporary view called "static_counts", this can be used in SQL queries external to the dataframe
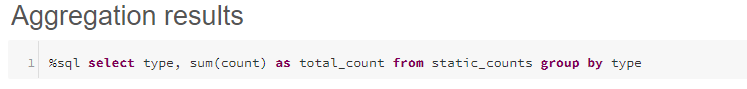
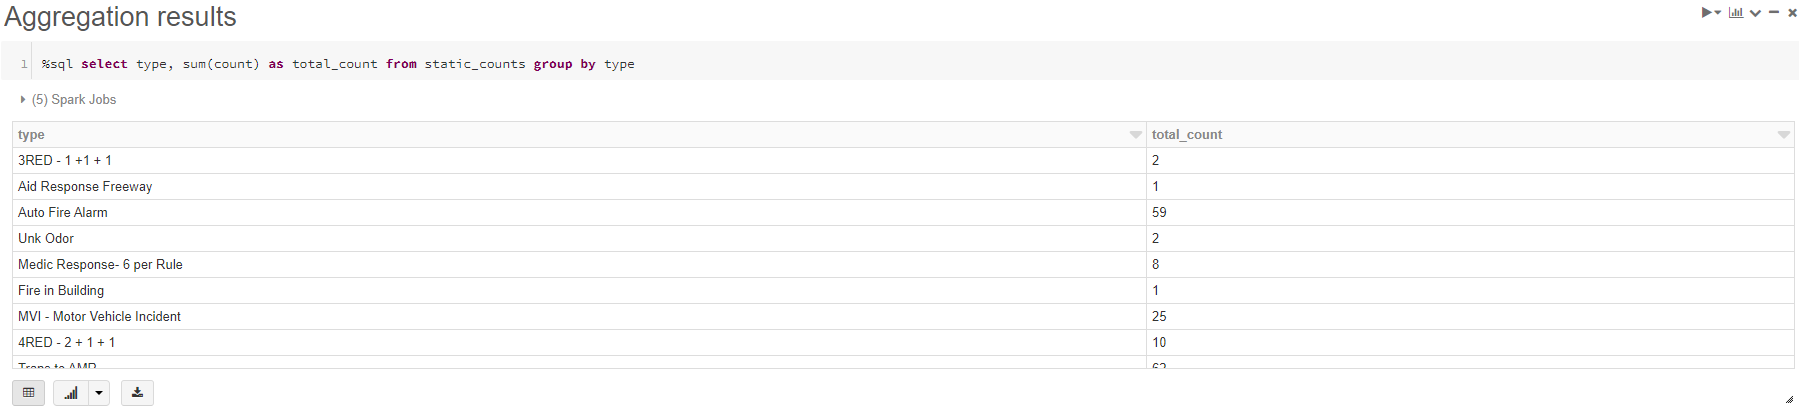
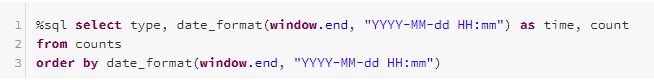
- Add another cmd cell and call it "Aggregation results" and add the following code. Note "%sql" switches the cell to contain SQL code rather than Python
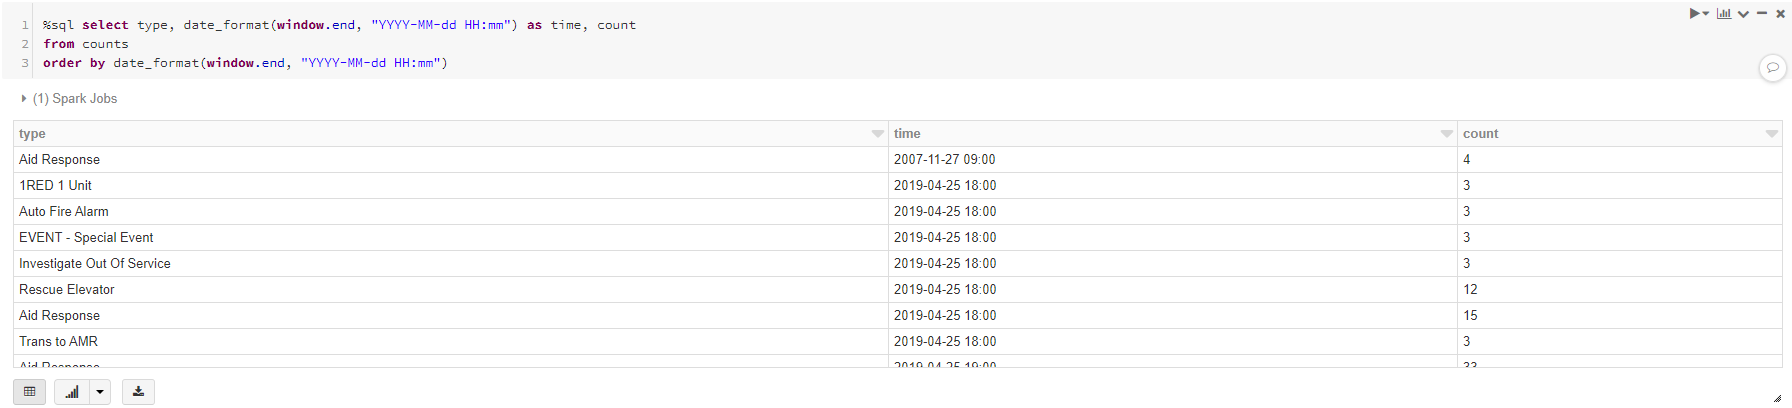
- Run the cell and look at the results

- The Data we have displayed above is a static representation of the data that we have saved in the folder. However what we really need is the data automatically loaded
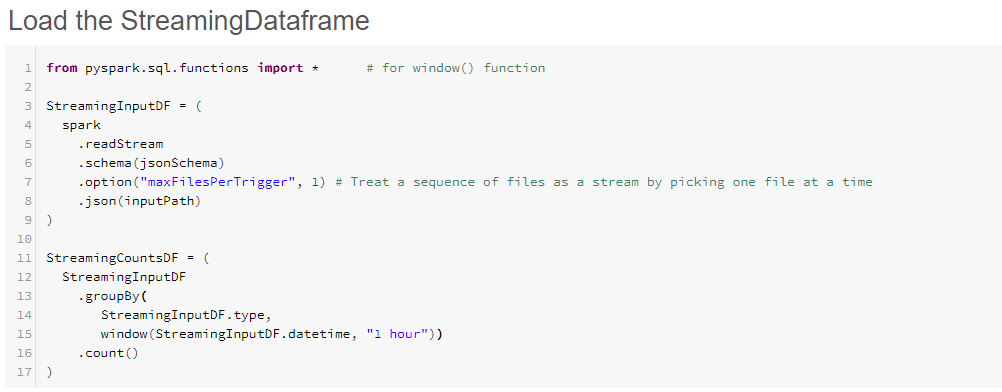
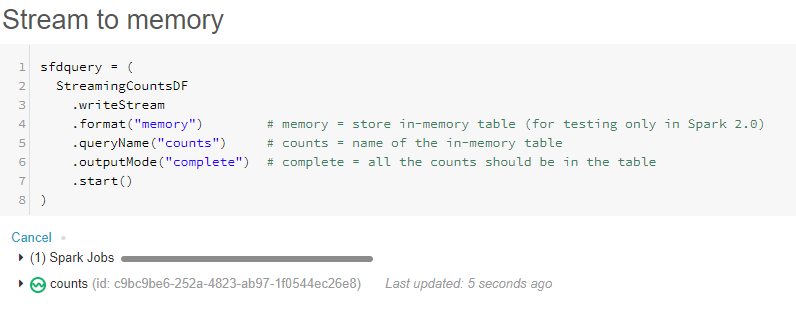
- Add a new cmd cell and name it "Load the Streaming Dataframe" and add the following code
-
-
readStream rather than read converts the static read to a streaming read
-
.option("maxFilesPerTrigger", 1)
-
-
-
Set some variables
-
Function to save the api data to a file
-
-
- Wait 5 minutes, then repeat the 2 steps above
In this post we have:
- Created a static dataset
- Created an aggregation on the dataset
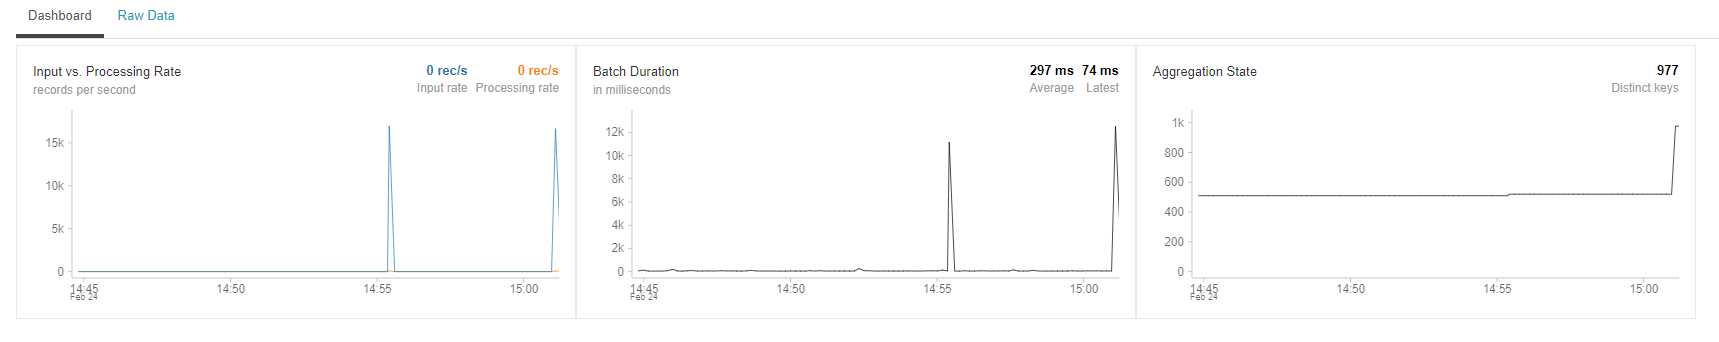
- Converted the dataset from static to streamed.
In the next post we will further explore structured streaming and additional options that are available.