
Travelling in time is something humans have dreamed of and written many novels and movies about, and today I felt kind of like that - from A Space Odyssey to another 80's classic, Gremlins 😊.
However, this gremlin is not scary like those you could not feed after midnight or get wet. In fact, the Gremlin that I will talk you about will become your best friend if you need to create a Graph Database in Cosmos DB.

Following my last post in the series about Cosmos DB where we saw how to create our first Cosmos DB database using the SQL API, I want to show you how to create your first Graph using the Gremlin API.
Background
Graph databases are No-SQL databases and, as we have seen previously, data is usually stored in JSON documents. These are no different, but in this case, they are classified in two different groups:
- Vertices, which in a ER model would be the entities
- Edges, which in an ER model, would be the relationships between the Entities.
Hold on a second, you are a DBA and I am telling you this is about Entities and Relationships, why do you need to learn about this? How is this any different to what you have been doing for the last 20 years?
Well, unfortunately we have all seen these 300+ lines of SQL queries with 20+ joins that you know when you start running them, but you never know if that’s going to finish today or tomorrow at 7pm.
Small databases are very forgiving because the amount of data you can pull at once is not that much, but when you start joining a 100M+ rows table to another 20M+ and more, either you are really proficient in query tuning or your application’s performance will be unpleasant.
Graph databases in Cosmos DB benefit from the same features, like the SQL API, it is globally distributed, scales independently throughput and storage, provides guaranteed latency, automatic indexing and more. So when relational databases choke with certain queries, No-SQL databases come to play.
Gremlin is the query language used by Apache Tinkerpop and it is implemented in Azure Cosmos DB. This language enables us to transverse graphs and answer complex queries that would be otherwise very expensive to run in traditional relational database engines.
Everyone Else’s Use Case Vs My Use Case
Every time I read or watch presentations about Graph databases, the use cases are always the same: Social Networks, Product Recommendations or the Busy Traveller… boring!
Today let’s imagine something super exciting; a football (or soccer) match! I know for lots of people it is just 22 guys chasing a football, but anyway, millions around the globe love it.
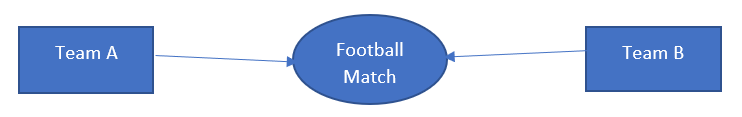
This can be our starting point for our Graph database, we have all elements.
- Vertices will be “Team A”, “Team B” and “Football Match”
- Edges will be the arrows from “Team A” and “Team B” to “Football Match”
I am sure my fellow DBAs did not see that coming 😊, the ‘Football Match” is not an Edge (Relationship), it’s a Vertex (Entity) - just not the same type as the football teams.
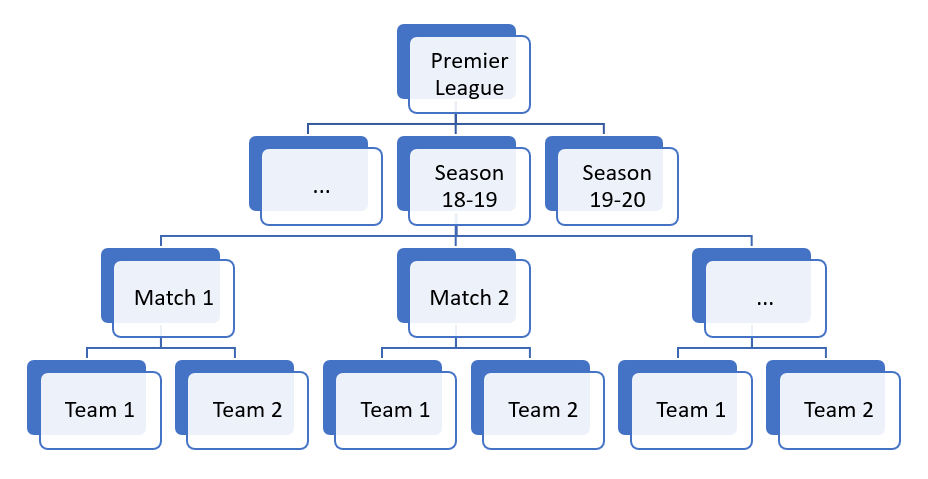
This is just one match, now imagine the Premier League: ten matches a week, thirty eight weeks each season, one season every year. Add players, stadiums, goal, faults, referees… Now we’re talking!
Kick-off
At this point I assume you all have access to an Azure subscription and have created a Cosmos DB account which will use the Gremlin API. If not, please see my posts First Steps with Cosmos DB and Creating your First Cosmos DB Database for details how to bring you up to speed.
First thing I need to create my Cosmos DB sample is the data, so I made a quick online search and found some CSV data I can use (thanks to FootyStats.org) and loaded into my local SQL Server instance. It is not the purpose of this blog to show how to import a CSV file, but with SSMS it is now very easy with the “Import Flat File” tool (in the Contextual menu of a database).
No-SQL databases don’t have specific hierarchies, but I believe (maybe my background is too dominant) that it can be helpful at some point, so first thing I will create the Vertices for the entity “Premier League”, then the different seasons (just one in this example), teams and matches to finally connect them with Edges.
To create a vertex using the Gremlin language, you need to provide:
- The label of the Vertex.
- The “id”, if we don’t provide one, Cosmos DB will give us a unique identifier.
- At least another property, which will define the partition key for our Graph, remember this is Cosmos DB.
See the following example to add the Premier League to our Graph:
- addV('football-league')
.property('id','premier-league')
.property('country','en')
.property('name','Premier League')
.property('year-creation','1992') - football-league will be the “label”, so we can add later other Leagues, like the Spanish “La Liga” or the German “Bundesliga”.
- ‘country’ is what I decided to use as partition key when I created the graph.
- ‘name’ and ‘year-creation’ are just properties, we can add as many as we need.
Every League have seasons, so we need to create them too:
- addV('football-season')
.property('id','premier-league-2018-2019')
.property('country','en')
.property('name','Premier League Season 2018-19')
The different matches, this was the opening match for the 2018-19 season, we need 380 like this:
- addV('match')
.property('id','1533927600-MANCHESTER-UNITED-LEICESTER-CITY')
.property('country','en')
.property('date_GMT','2018-08-10 19:00:00.0000000')
.property('attendance','74439')
.property('stadium_name','Old Trafford')
.property('home_team_name','Manchester United')
.property('away_team_name','Leicester City')
.property('home_team_goal_count_half_time','1')
.property('away_team_goal_count_half_time','0')
.property('total_goal_count','3')
.property('home_team_goal_count','2')
.property('away_team_goal_count','1')
.property('abc', 'value')
And obviously, we need the teams that play those matches:
- g.addV('team')
.property('id', 'ARSENAL')
.property('country', 'en')
.property('name', Arsenal FC')
.property('common_name', 'Arsenal')
.property('league_position','5')
However, after adding all these Vertices, we have nothing but a bunch of JSON documents with properties, but that is not where the real power of the Gremlin API is.
We need to create the Edges that connect them and allow us to jump from one to another (transverse) and get powerful insights. The more links (Edges) between our entities (Vertices), the more questions we will be able to answer.
Connecting the Dots
As I said, the more Edges (links or relations) between the Vertices, the more questions we can answer.
It worth mention that Edges connect two and only two Vertices and they are unidirectional. Nothing stops you though from creating an unlimited number of Edges between the same Vertices in the desired direction, just bear in mind each is a new document and you pay for storage too.
At this point we will create the following edges:
- Between the league and its season(s)
- Between the seasons and the teams that played the season
- Between the seasons and their matches
- Between the matches and the teams that played the match
That will allow us from a given league, to jump to the season we want and to the match we want and the teams we want.
To create Edges we do it as follows:
- League to season:
- g.V().has('id', 'premier-league') // from the League Vertex
.addE('has-season') // Add the Edge 'has-season'
.to(g.V().has('id','premier-league-2018-2019')) // to the Season Vertex
- g.V().has('id', 'premier-league') // from the League Vertex
- Team to season
- g.V().has('id', 'AFC-BOURNEMOUTH')
.addE('participates')
.to(g.V().has('id','premier-league-2018-2019'))
- g.V().has('id', 'AFC-BOURNEMOUTH')
- Season to match
- g.V().has('id', 'premier-league-2018-2019')
.addE('season-match')
.to(g.V().has('id','1533927600-MANCHESTER-UNITED-LEICESTER-CITY'))
- g.V().has('id', 'premier-league-2018-2019')
- Match to team playing home
- g.V().has('id', '1533927600-MANCHESTER-UNITED-LEICESTER-CITY')
.addE('plays-home')
.to(g.V().has('id','MANCHESTER-UNITED'))
- g.V().has('id', '1533927600-MANCHESTER-UNITED-LEICESTER-CITY')
- Match to team playing away
- g.V().has('id', '1533927600-MANCHESTER-UNITED-LEICESTER-CITY')
.addE('plays-away')
.to(g.V().has('id','LEICESTER-CITY'))
- g.V().has('id', '1533927600-MANCHESTER-UNITED-LEICESTER-CITY')
I did this for the whole season by writing some SQL to generate the Gremlin Queries and then used the GremlinNetSample to load them in my Cosmos DB Graph, if you're interested in how I did it, please let me know.
Some Query Examples
Once I have loaded the +1500 Vertices and Edges to complete one Premier League season, we can start writing some queries. All Gremlin queries start with “g” which I assume stands for "Graph".
To get all Vertices:
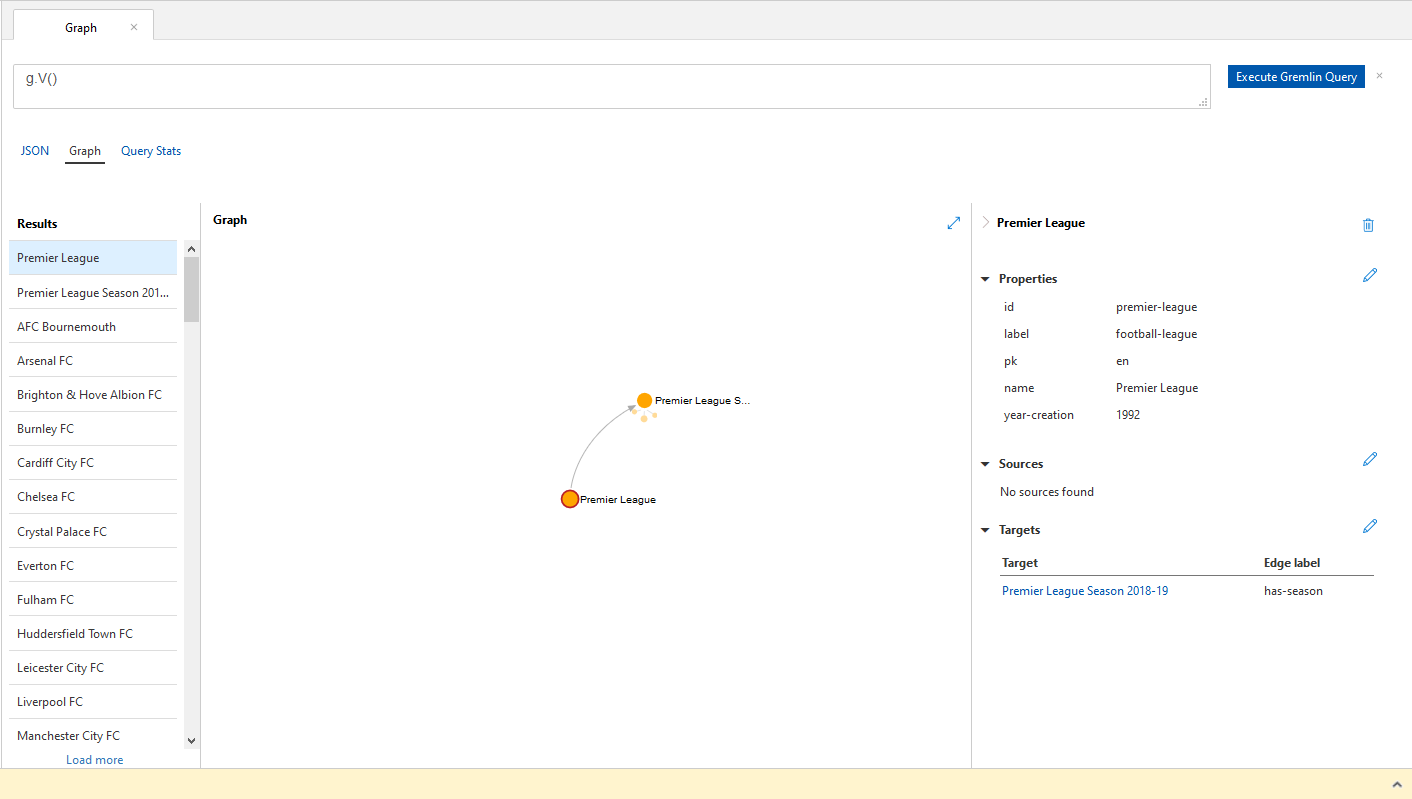
- g.V(), this will get all Vertices in our Graph.
In the Azure Portal when we run a query that returns one or more Vertices, we can see all this:
-
- JSON, this is all the JSON documents returned by the query. That is what our applications consume.
- Graph where we can see: representation, which will be of the first Vertex (or whichever is selected on the results list). Note that not all Vertices connected to the selected one are displayed if there are more than 10 or so. We can navigate to the different Vertices displayed by clicking on any of them.
- Results, which are all Vertices returned by our query. We choose from the list to see them in the Graph.
- Graph, the graphical representation of the selected Vertex. Note that if there are more than 10 Vertices connected to the selected one not all are displayed. We can navigate to the different Vertices displayed by clicking on them.
- Properties (on the right), which are what we defined upon creation, we can Add/Delete/Update properties in the Portal
- Query Stats, the cost in RU/s of the query we have run, very useful to get a ball park figure of our throughput requirements.
To get all Edges:
- g.E()
As opposed to Vertices, Edges are not graphically represented unless they are connecting two Vertices, so we only get the JSON output of any queries that returns one or more Edges.
Some queries I’ve written, see like in SQL language, there are many ways to get to the same results:
/*
-- One Vertex by Id (id can exists in one or more partitions!!)
g.V('HUDDERSFIELD-TOWN') 				--> 3.5900000000000003 RU/s
g.V('id', 'HUDDERSFIELD-TOWN')				--> 3.9299999999999997
g.V().has('id','HUDDERSFIELD-TOWN') 			--> 3.95
g.V('HUDDERSFIELD-TOWN').has('country', 'en') 		--> 4.29
g.V().has('id','HUDDERSFIELD-TOWN').has('country', 'en') --> 4.65

-- All matches in a season
g.V('premier-league-2018-2019').OutE('season-match').InV()

-- Away matches for one team
g.V('HUDDERSFIELD-TOWN').InE('plays-away')

-- Number of matches they played away
g.V('HUDDERSFIELD-TOWN').InE('plays-away').Count()

-- Number of matches they played away group by team
g.V('HUDDERSFIELD-TOWN').InE('plays-away').OutV().GroupCount()

-- Matches away for HUDDERSFIELD with home and away goals
g.V('HUDDERSFIELD-TOWN').InE('plays-away').OutV().valueMap('home_team_name','home_team_goal_count','away_team_goal_count')

-- Home Teams HUDDERSFIELD played in Away matches
g.V('HUDDERSFIELD-TOWN').InE('plays-away').OutV().OutE('plays-home').InV()

--team that scored most goals playing home against HUDDERSFIELD
g.V('HUDDERSFIELD-TOWN').InE('plays-away').OutV().OutE('plays-home').InV().order(local).by('home_team_goal_count', Order.decr).limit(1)

-- teams playing at home, that has scored 5 or more goals against HUDDERSFIELD
g.V('HUDDERSFIELD-TOWN').InE('plays-away').OutV().has('home_team_goal_count', gte('5'))

-- teams that have scored scored 4 or more away goals against HUDDERSFIELD
g.V('HUDDERSFIELD-TOWN').InE('plays-home').OutV().has('away_team_goal_count', gte('4')).OutE('plays-away').Inv()

-- teams that have scored scored 4 or more away goals against HUDDERSFIELD AND have received 3 or more goals playing at home.
g.V('HUDDERSFIELD-TOWN').InE('plays-home').OutV().has('away_team_goal_count', gte('3')).OutE('plays-away').Inv().InE('plays-home').OutV().has('away_team_goal_count', gte('3')).OutE('plays-away').Inv()

*/
Even though I’m only scratching the surface, you can see how complex it might get, but the possibilities are huge.
If you check the last query, I was “jumping” in and out Vertices using the Edges and filtering on properties to answer a complex question.
And the best is that the cost was right under 70 RU/s, which is what I can expect regardless the number of Vertices I have in my Cosmos DB Graph!
I consider myself proficient with relational databases on both design and querying and I can tell you that a SQL query like that can be a challenge from a performance point of view.
In the previous examples, there is a lot of SQL-like functionality like Grouping, Ordering, Filtering, Top (limit) to get you started using Gremlin if, like me, you come from a SQL background.
Conclusion
Graph databases are becoming more popular nowadays, so I encourage you to give them a go and have some fun just like I did to write this post and the demos.
I hope you enjoyed the reading and if you have any questions, feel free to ask.
Thank you!