
I was recently engaged with a client in building a report that had some very specific requirements; a paginated report that compared datasets from two different date ranges. Initially the client attempted to build the report in Power BI Desktop, however since the report needed to be paginated and exported to PDF, it meant that Power BI Desktop wasn't really suitable. At this point we started to explore the capabilities of Power BI Report Builder. In this blog post, I'll introduce you to Power BI Report Builder by explaining how I solved a date filtering problem using Date Pickers, all whilst using a published Power BI Dataset.
What is Power BI Report Builder?
For as long as I remember, the Power BI community have been crying out for report pagination in Power BI. Fortunately, this capability has been out for a while and only in the last year has the full story been sewn together. For the uninitiated, let's take a look back and understand where pagination in Power BI has come from and where we are today.
Microsoft announced the availability of Paginated Reports in Power BI Premium in June 2019, following a Public Preview in November 2018. This enabled organisations with Power BI Premium backed workspaces to upload, view and interact with traditional SQL Server Reporting Services (SSRS) reports directly in the Power BI Portal. These reports are more commonly referred to as Report Definition Language (RDL) files.
In April 2019, there was an interesting development; Microsoft announced the availability of a new report authoring tool known as Power BI Report Builder. Its sole purpose - to be the primary authoring tool for paginated reports in the Power BI Service.
Power BI Report Builder is a freely available tool from Microsoft. After installing it, you'd be forgiven for thinking it's just SSRS Report Builder rebranded. It looks the same; the icons, buttons, dialogs, even the Office ribbon - all emit that traditional look and feel. Whilst the differences appear to be skin-deep, it's only when you start creating and publishing reports do you realise the major changes are under the hood. For example, when you create a new data source connection, there's now an option for connecting to a Power BI Dataset, enabling you to build visuals in your report using a published Power BI Dataset! Other data sources are also available such as SQL Server, Azure SQL Database, Azure SQL Data Warehouse, plus many more. These data sources appear to be a subset of what's available in SSRS Report Builder today, so expect to see further updates as time goes by and the tool matures. Finally, when you're finished authoring the report, it can be saved locally as an RDL file or published to a Premium workspace in the Power BI Service for others to consume.
With that, we've now got the full picture:- we have Power BI Report Builder to create our paginated reports from Power BI Datasets and other popular data sources. We also have the Power BI Service where we can publish paginated reports to Premium backed workspaces, as well as the ability to export to formats such as PDF and Microsoft Excel.
Now let's look at the date filtering problem I had…
Date Pickers and Date Dimensions
It's not uncommon to want to be able to filter a report between two dates - that is exactly what I wanted to achieve with my client! Furthermore, since my Power BI Dataset contained a date dimension I wanted to use that to ensure my model was filtered correctly depending on the date ranges specified. Other people have done a great job of explaining how to use Data Pickers in SSRS - in fact there is a great explanation here. This was written on the basis that you're using Analysis Services Multidimensional Models and therefore Multidimensional Expressions (MDX) to query the cube. However, we know that Power BI utilises Tabular Models as opposed to Multidimensional Models and therefore Data Analysis Expressions (DAX) is used to query the dataset, as opposed to MDX. So, how did I manage to use the Date Picker with a Power BI Dataset?
For demonstration purposes, the following steps use sample data from the Land Registry web site.
-
Launch Power BI Report Builder and create a Blank Report. Alternatively, use your existing report.
-
Right-click Data Sources in the Report Data windows and select Add Power BI Dataset Connection…
-
Navigate to the correct workspace and select your Power BI Dataset.
-
Now create a new Dataset in Report Builder, by right-clicking the Datasets folder in the Report Data window.
-
Give the Dataset a name and use the Data Source connection created in step 2. Click Query Designer.
-
Drag the appropriate levels and measures onto the design area.
-
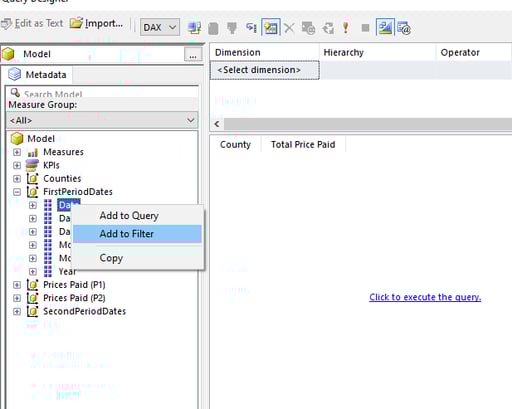
Find and right-click the date column within your date dimension table and select Add to Filter.
-
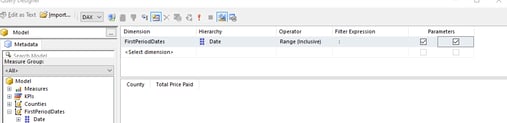
Change the dimensions Operator to Range (Inclusive) and then tick both checkboxes in the Parameter column (as shown below). This will ensure that both the From and To date parameters appear as report-level filters when the report runs. Now click OK.
- You'll notice some rather complex, auto-generated DAX in the Query section of the Dataset Properties dialog. Whilst we don't need to worry too much about this, it's important to understand what's happening on the last line (as below):
EVALUATE SUMMARIZECOLUMNS('Prices Paid (P1)'[County], FILTER(VALUES('FirstPeriodDates'[Date]), (FromFirstPeriodDatesDate1ALL || 'FirstPeriodDates'[Date] >= DATEVALUE(FromFirstPeriodDatesDate1) + TIMEVALUE(FromFirstPeriodDatesDate1)) && (ToFirstPeriodDatesDate1ALL || 'FirstPeriodDates'[Date] <= DATEVALUE(ToFirstPeriodDatesDate1) + TIMEVALUE(ToFirstPeriodDatesDate1))), "Total Price Paid", [Total Price Paid]) -
Notice how the query uses DATEVALUE and TIMEVALUE DAX functions to return date and time values for the specified dates (i.e. the two date parameters), which it then uses to compare and filter the data in the date dimension table (FirstPeriodDates). This tells us that the dates passed into the DAX query should be passed as formatted date strings to enable the model to convert those strings into datetime values. Remember, you can’t compare string types with datetime types - everything needs to be the same type. Since FirstPeriodDates table stores my dates as datetime types, the conversion to datetime is required! Click OK on the Dataset Properties dialog.
-
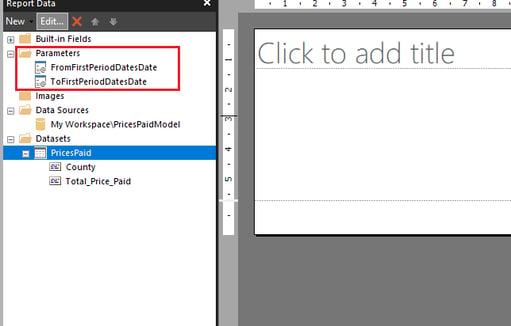
In the Report Data window, expand the Parameters folder. You'll notice two parameters; a From and To parameter. By right-clicking and selecting the Parameter Properties, you'll notice the Data Type is set to Text. Whilst this is valid, it means our date parameters will use drop down lists, which isn't very user friendly! To use Date Pickers for these parameters, change their Data Types to Data/Time. This will ensure that Date Pickers are displayed when the report runs.
-
Whilst on the Parameter Properties dialog, select the Available Values tab and select None. On the Default Values tab, enter =Today() as the Default Value. This will display the current date by default on the Date Picker. Now click OK.(Repeat steps 10 and 11 on both the From and To parameters).
-
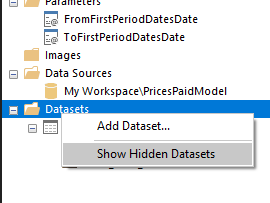
Right-click on the Datasets folder in the Report Data window and select Show Hidden Datasets.
-
Two additional datasets will be shown that used to reference the From and To parameters. Since these datasets were initially providing our parameters with available values, they can now be deleted as the parameters no longer have any Available Values (they use Date Pickers instead!).
-
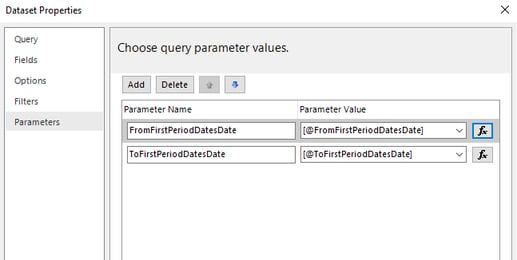
Right-click the dataset created in step 3 and select Dataset Properties. Once the dialog is displayed, select the Parameters tab.
-
You'll see two parameters with values (as below). These parameter values are passed into the DAX query. Click the fx button next to the textboxes to show the expressions. For each parameter, the date value is simply being returned. Since we've changed the parameters to use Date/Time data types, the value being returned will be a datetime type, which isn't compatible with the auto-generated DAX we saw in step 8 (it requires a string!). If the report runs now, an exception will be thrown with a message stating that a conversion error occurred.
-
To ensure the correct data type is passed into the DAX query, replace the parameter value with the following expression, where <your_parameter_name> is the name of your parameter. The Format function returns a string formatted to a given condition, in this case it will be a date string in the format of yyyy-MM-dd.
=Format((Parameters!<your_parameter_name>.Value), "yyyy-MM-dd")
- We're now ready to test the report! Create a simple Tablix from the dataset created in step 3 and click Run. You should see a Date Picker displayed; now specify a From and To date and click View Report…. et Voila!! A Power BI paginated report, using a Power BI Dataset, filtered using Date Pickers!
Closing thoughts
The ability to create paginated reports has and always will be a requirement for many organisations. Power BI Report Builder is a great tool - it has its frustrations - mainly when you haven't run the report for a while and you get "Unauthorized" exceptions at run-time, meaning the you have to restart the tool! However, that is a small inconvenience to pay when compared with the overall benefit this tool provides. I hope that by describing a problem I've had to solve using Power BI Report Builder, I've provided enough by way of an introduction and summary of its capabilities.
Thanks for reading, until next time!