
In this post, we investigate the powerful test and release capabilities of Power BI Premium.
I previously wrote about Power BI Premium per User. Opening up premium features to a broader audience unlocks many attractive options.
None of us is perfect. You have many opportunities to introduce errors into your Azure Analytics architecture:
- Data source problems with views or stored procedures.
- Extract, load and transform logic going awry.
- Python notebooks not considering boundary conditions.
- Data Lake auto-archiving is removing production data.
- Data Flows in Power BI mishandles nulls.
- Azure Synapse Analytics views or stored procedures don't group data properly.
- DAX code bug incorrectly calculates year-to-date numbers.
- Scheduled tasks don't trigger.
How do you check data moves from source to report visual correctly, and what is the best way to release change through your development, test and production environments? Enter deployment pipelines:
Deployment Pipelines
Deployment pipelines follow the standard software build methodology of Development, Test and Production environments. Create your development workspace on Power BI Premium dedicated capacity and publish your Power BI desktop content as you have always done. There is nothing new so far, so what do deployment pipelines provide for you?
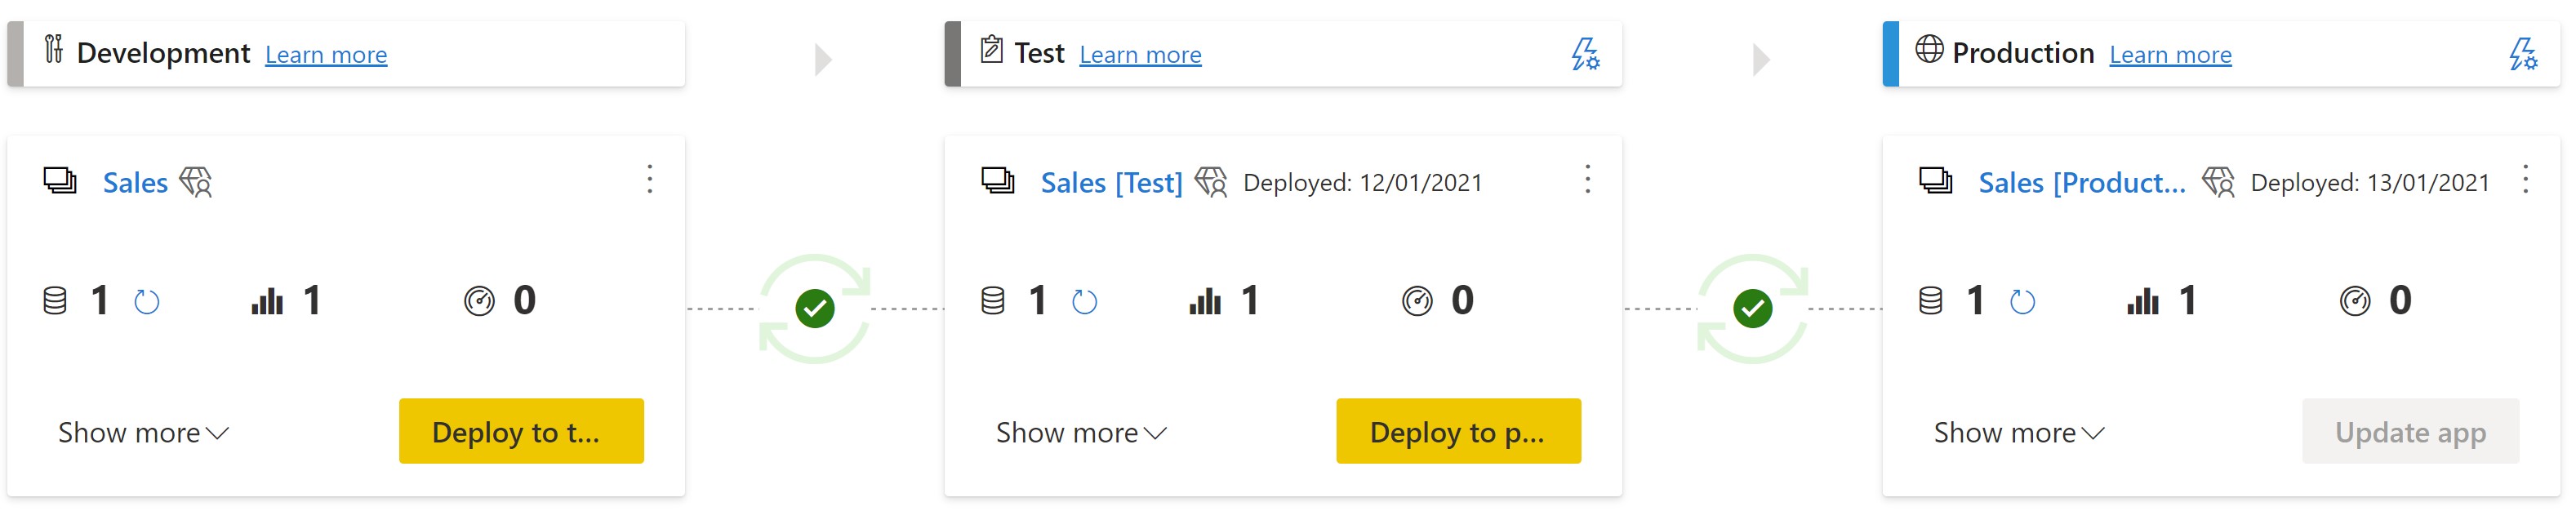
- You first see a dashboard (image below) showing an overview of each type of Power BI entity (report, dataset and dashboard) in each environment.
- Deployment pipelines create the test and production Power BI workspaces for you. You can see the "Sales [Test]" and "Sales [Production]" workspaces below.
- Hyperlinks allow you to navigate directly to each workspace.
- Icons (the green tick icon below) will show you drift where your Power BI content differs between environments.
- Buttons allow you to migrate reports, dashboards, and datasets to test and production with a single click.
- The lightning icon opens a deployment settings blade where you apply dataset rules to modify each environment's data sources.
Compare
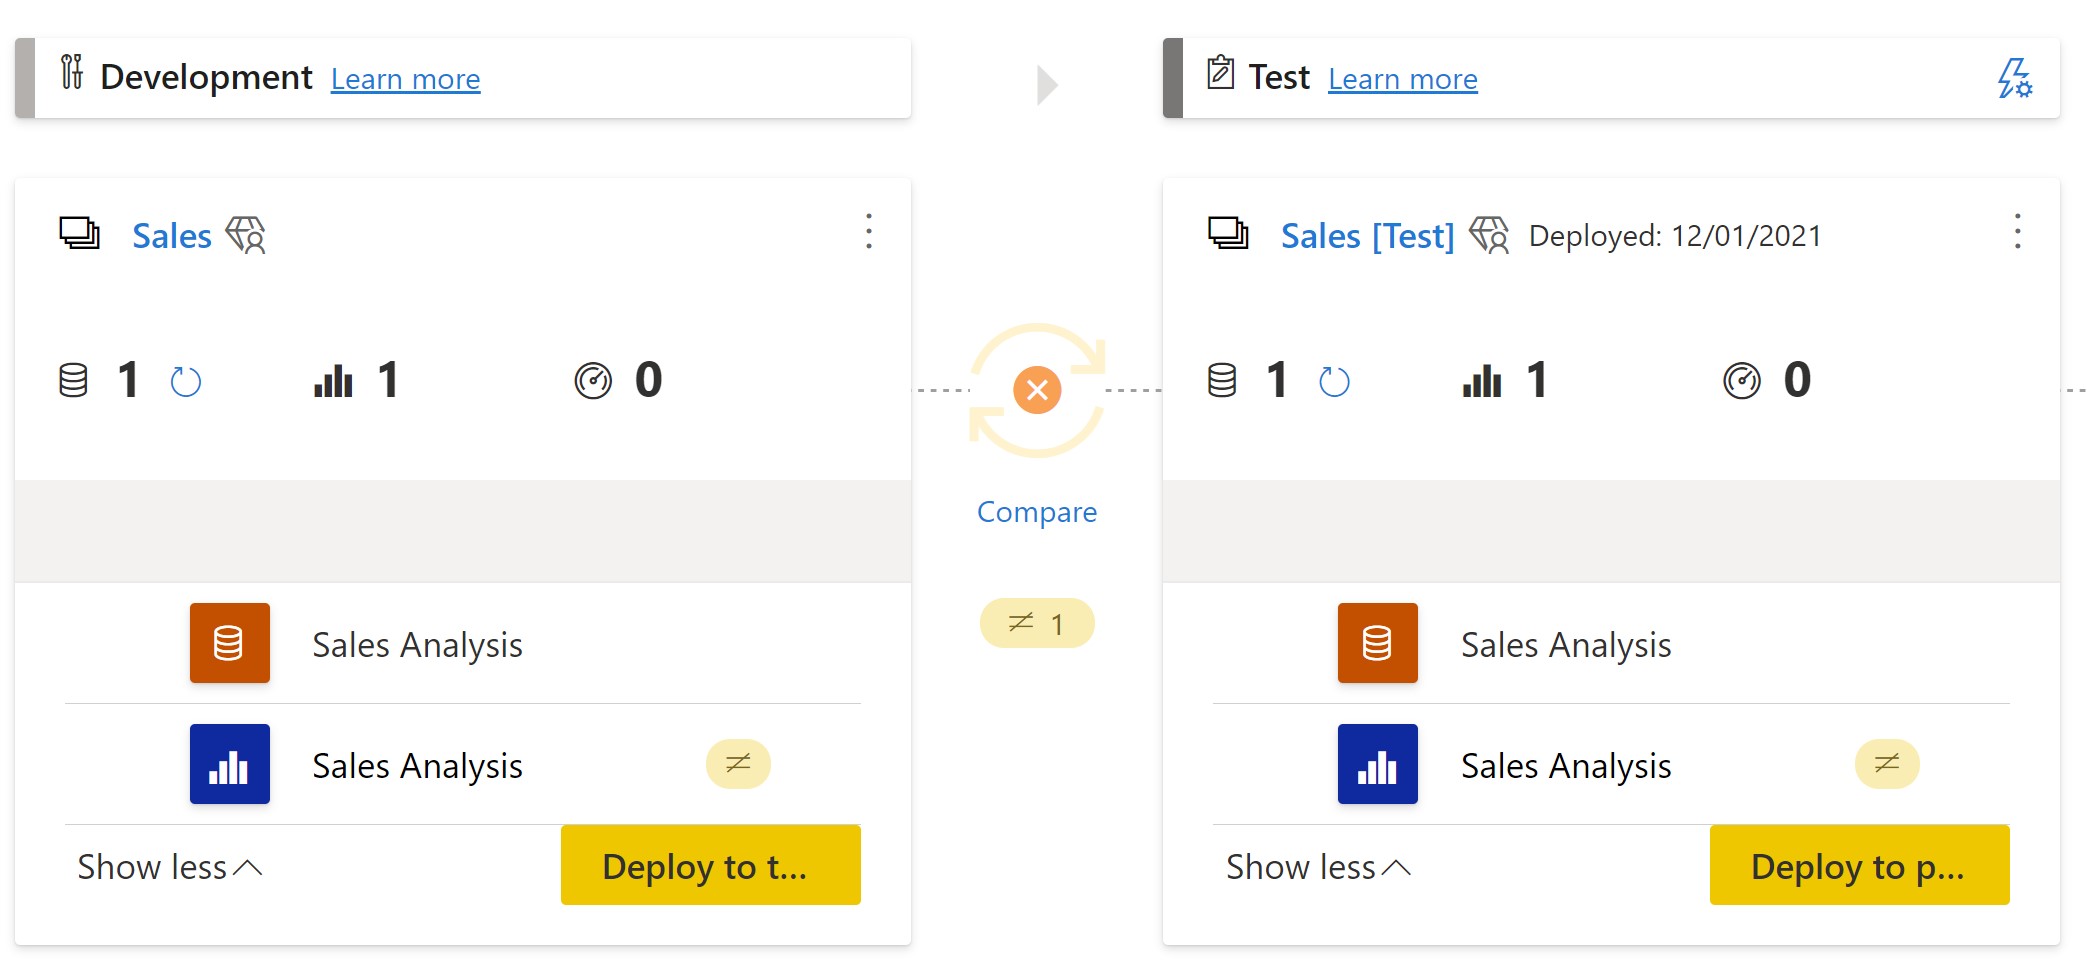
When the green tick changes to an orange cross, click the compare hyperlink to show you exactly where content differs between environments.
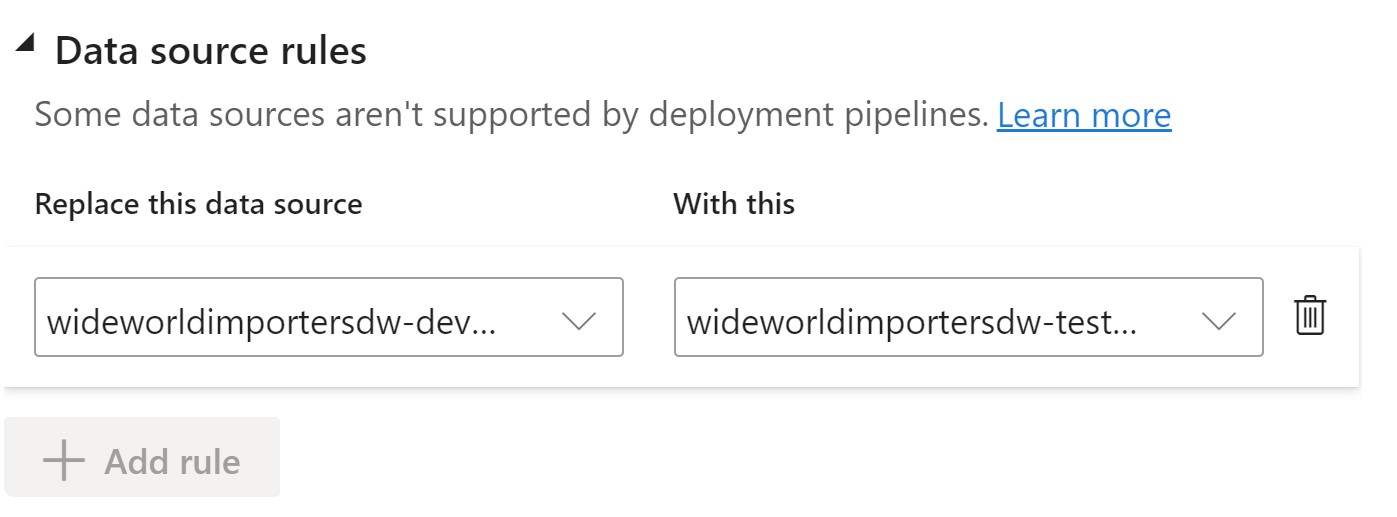
Dataset Rules
The lightning icon next to each workspace name allows you to tailor the data source for each environment. The data source for development here is the Azure SQL Database WideWorldImportersDW-Dev. However, the deployment pipeline replaces the database name with WideWorldImportersDW-Test during the Test workspace transition, a powerful feature.
Have you ever manually published your production Power BI report but retained your test environment's data source? Errr, no me neither. That could potentially be an embarrassing situation with a production report displaying test data to the business. That problem is now solved, and you can release change with confidence as Power BI applies your rules during each deployment.
System Testing
We now have a fantastic mechanism to deploy a change, but how do we know all is well before we click the "Deploy to test", "Deploy to production" or "Update app" buttons?
Ideally, we would unit test the smallest code component within each tier of your Azure Analytics architecture mentioned at the start. Unfortunately, robust unit testing frameworks, including the ability to mock objects and more, struggle to keep up with the cadence of new services available to us in Azure.
The solution I describe here is a system test rather than a unit test. We run a complete end-to-end Extract, Load and Transform process in a non-production environment and verify Power BI displays the correct numbers and measures.
XMLA Endpoint
Power BI Premium uses the XML for Analysis (XMLA) endpoint protocol, which opens up some exciting testing opportunities. You may ask why you can't perform this testing directly within Power BI by creating visuals and verifying numbers? The answer is you can. However, the method below allows you to execute many tests and capture the results in a scripted manner. This approach enables extensive test coverage over your whole semantic model, highlighting all errors you must fix before progressing with a production release.
Test using DAX
The availability of the XMLA endpoint allows us to point external tools at Power BI datasets. Examples are SQL Server Management Studio or DAX Studio (as shown below).
- Install the latest version of DAX Studio from https://daxstudio.org/
- Navigate to the settings of your workspace in Power BI (ensure you host the workspace on Power BI Premium dedicated capacity) and hit the copy button:
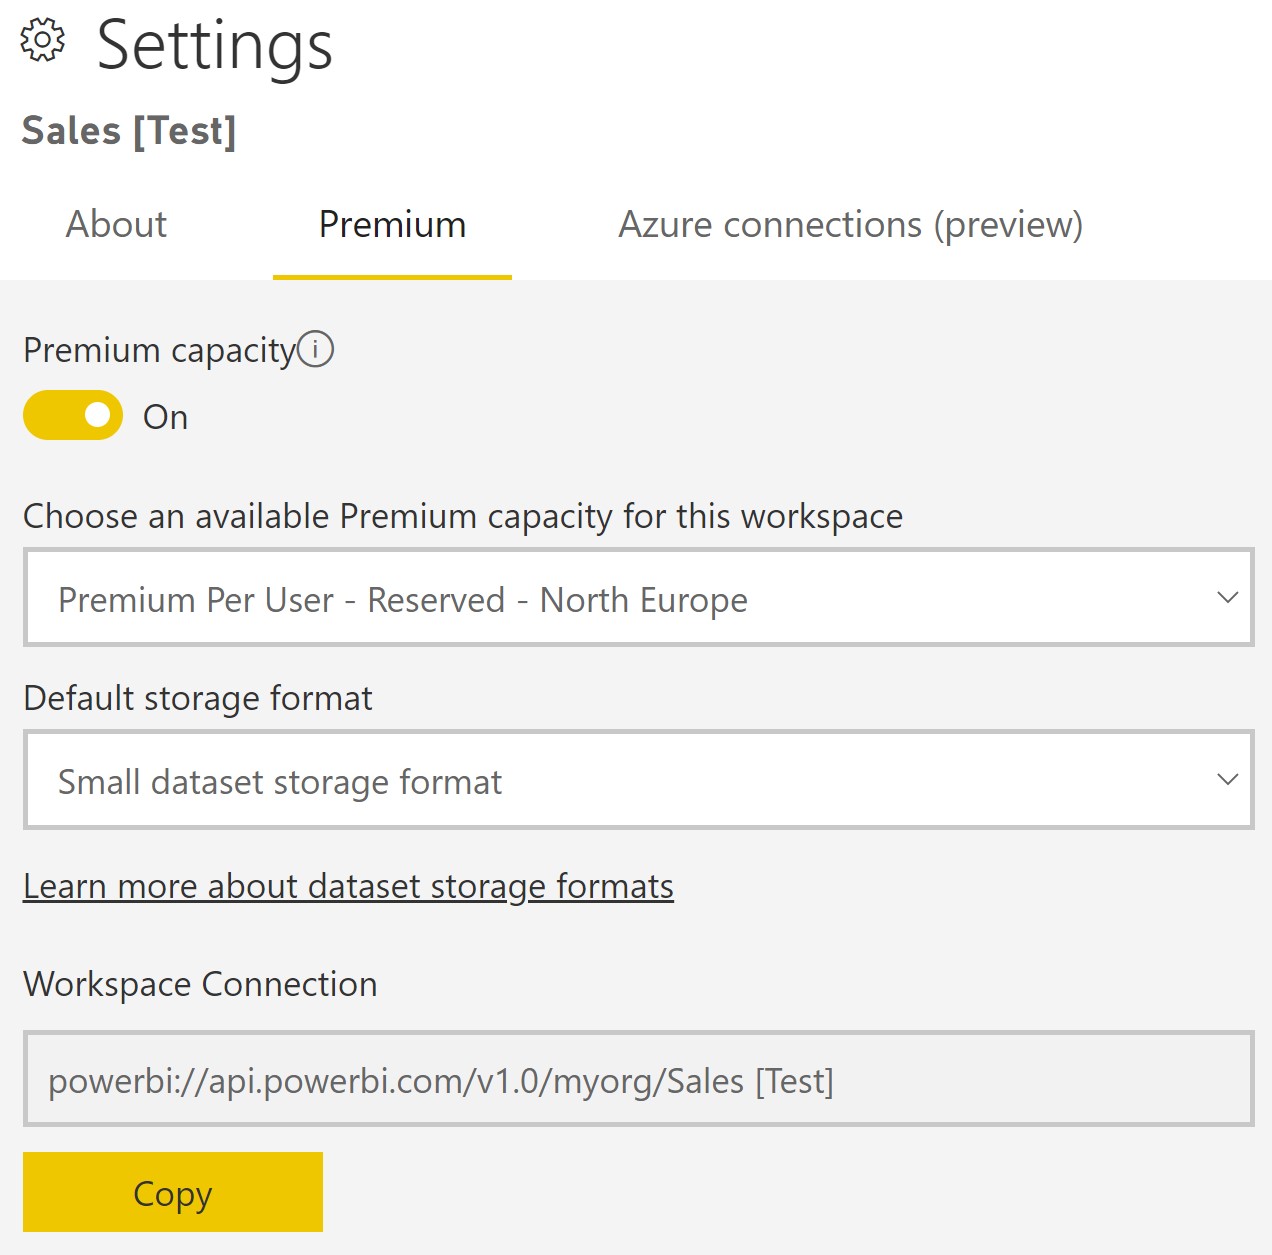
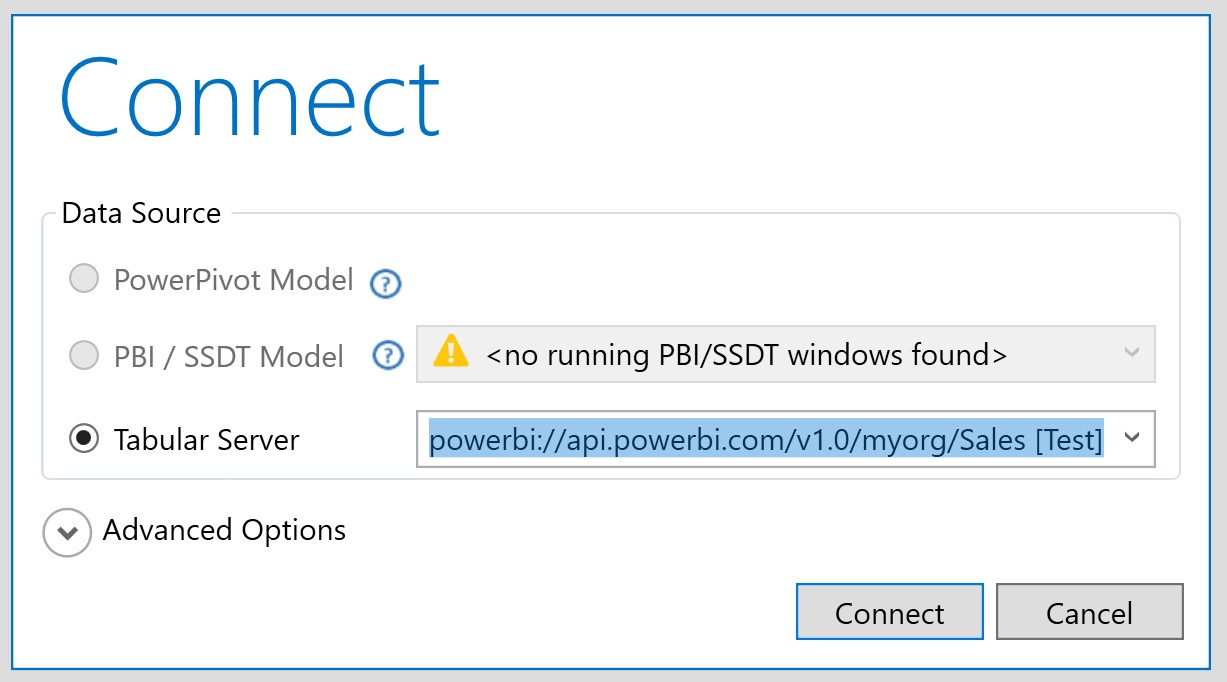
- Click the Connect button in DAX Studio, and paste the link copied above in the Tabular Server box.
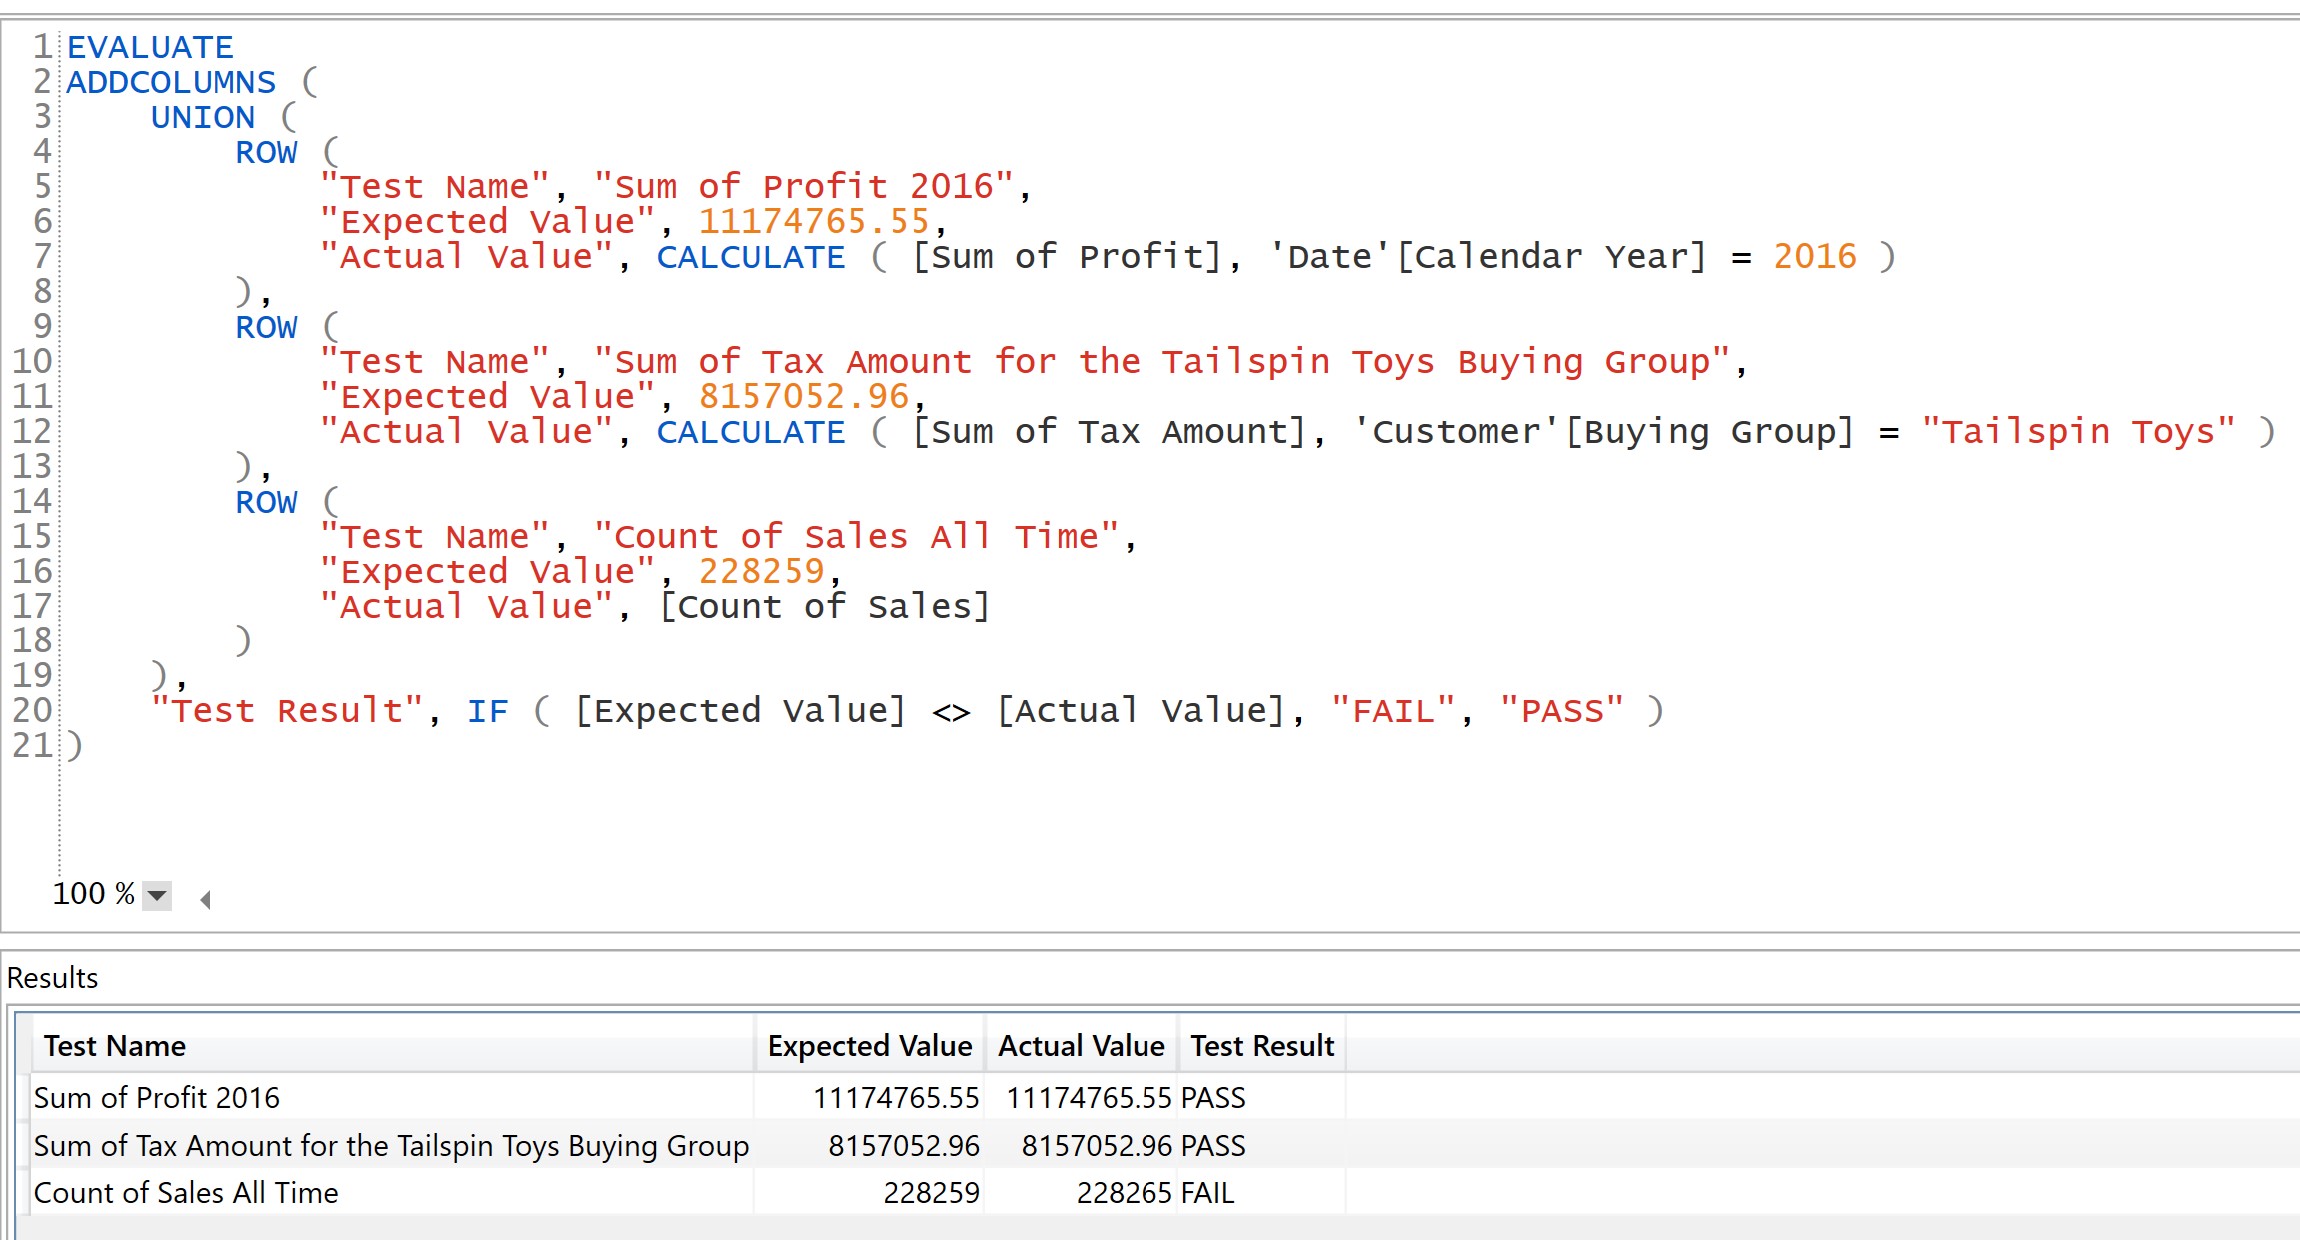
- Write a DAX query similar to that below, and hit F5 to get a table of all your test results:
This appeal of this approach is you continually enhance your tests as the requirements and reports evolve. Add as many rows as you wish to the union expression. You will never achieve 100% coverage with any testing solution, but the old rule of one test is better than none still holds. You will catch many errors with a straightforward suite of a few tests, but you might cover your more complex data models with hundreds of tests. As a minimum, you should add tests for each dimension, for example, test sales metrics for customers, products, stores, dates, salespersons and promotions. Also, try to cover as many dimension attributes as possible. For example, a pass for the 'Customer'[Buying Group] test above doesn't imply the 'Customer'[City] attribute is correct, and you should test that independently. The more tests you have, the more robust your solution and the easier your life is moving forward.
Employ a test-driven development approach. The process is to write the test first. After the test fails, you write the minimum amount of code (e.g. change your DAX or ELT process) for the test to pass. Writing the test first is a great way to clarify the scope of work before you start.
You can use the same DAX testing method in production, should end-users report problems with your live reports. Create a DAX script to test your production measures and discover where you should focus your efforts to apply a fix.
Deterministic
Of course, you must know the expected values within your business before testing. You might get these numbers from legacy reports, accounting software or elsewhere. A real problem might be the Power BI roll-out is the first time a company has the powerful ability to slice and dice all its data. Establishing the correct metrics for all dimensions might be a non-trivial task. You must consider this in your cloud adoption planning stage and know the right numbers for a broad range of dimensions.
Another consideration is non-deterministic measures. For example, you probably don't track the change of your customer's date of birth in a slowly-changing dimension. When a birth date changes in the source system, you update your data warehouse's customer dimension. The consequence of this is a measure like "Sum of Sales Amount in 2016 for the 20-25 age banding" might report a different number when viewing a report in 2018 to 2019, i.e. some measures are temporal and change over time. This data scenario is legitimate and something else you must consider when testing.
Wrapping up
Deployment pipelines and the XMLA endpoint are just two of the many enticing features released to Power BI Premium. The rate of enhancements to Power BI is relentless with many more improvements either in preview or outlined by Microsoft on its roadmap. The continuous addition of new functionality is the real benefit when creating your Azure Analytics solution with Power BI. The products and services improve and evolve automatically with no expensive upgrade project required from you.
Try Power BI Premium's test and release capabilities and see if they help you deploy reports faster and more reliably.