
Power BI is a fantastic data visualisation tool to measure the success of your business. But how do you measure your key metrics, and what options are available to you in Power BI?
It's effortless to get started with Power BI by importing a dataset, then dragging and dropping columns onto the reporting canvas. However, this approach might run into performance and scalability problems, and you're also only scratching the surface of the tool's capabilities.
You might have heard these terms:
- Facts
- Measures
- KPIs
- Goals
Read on to see how you apply these concepts to take your Power BI reports to the next level.
We will get started with a Coeo example Power BI report below. This anonymised example is from the finance world, but these concepts apply to all scenarios and sectors.
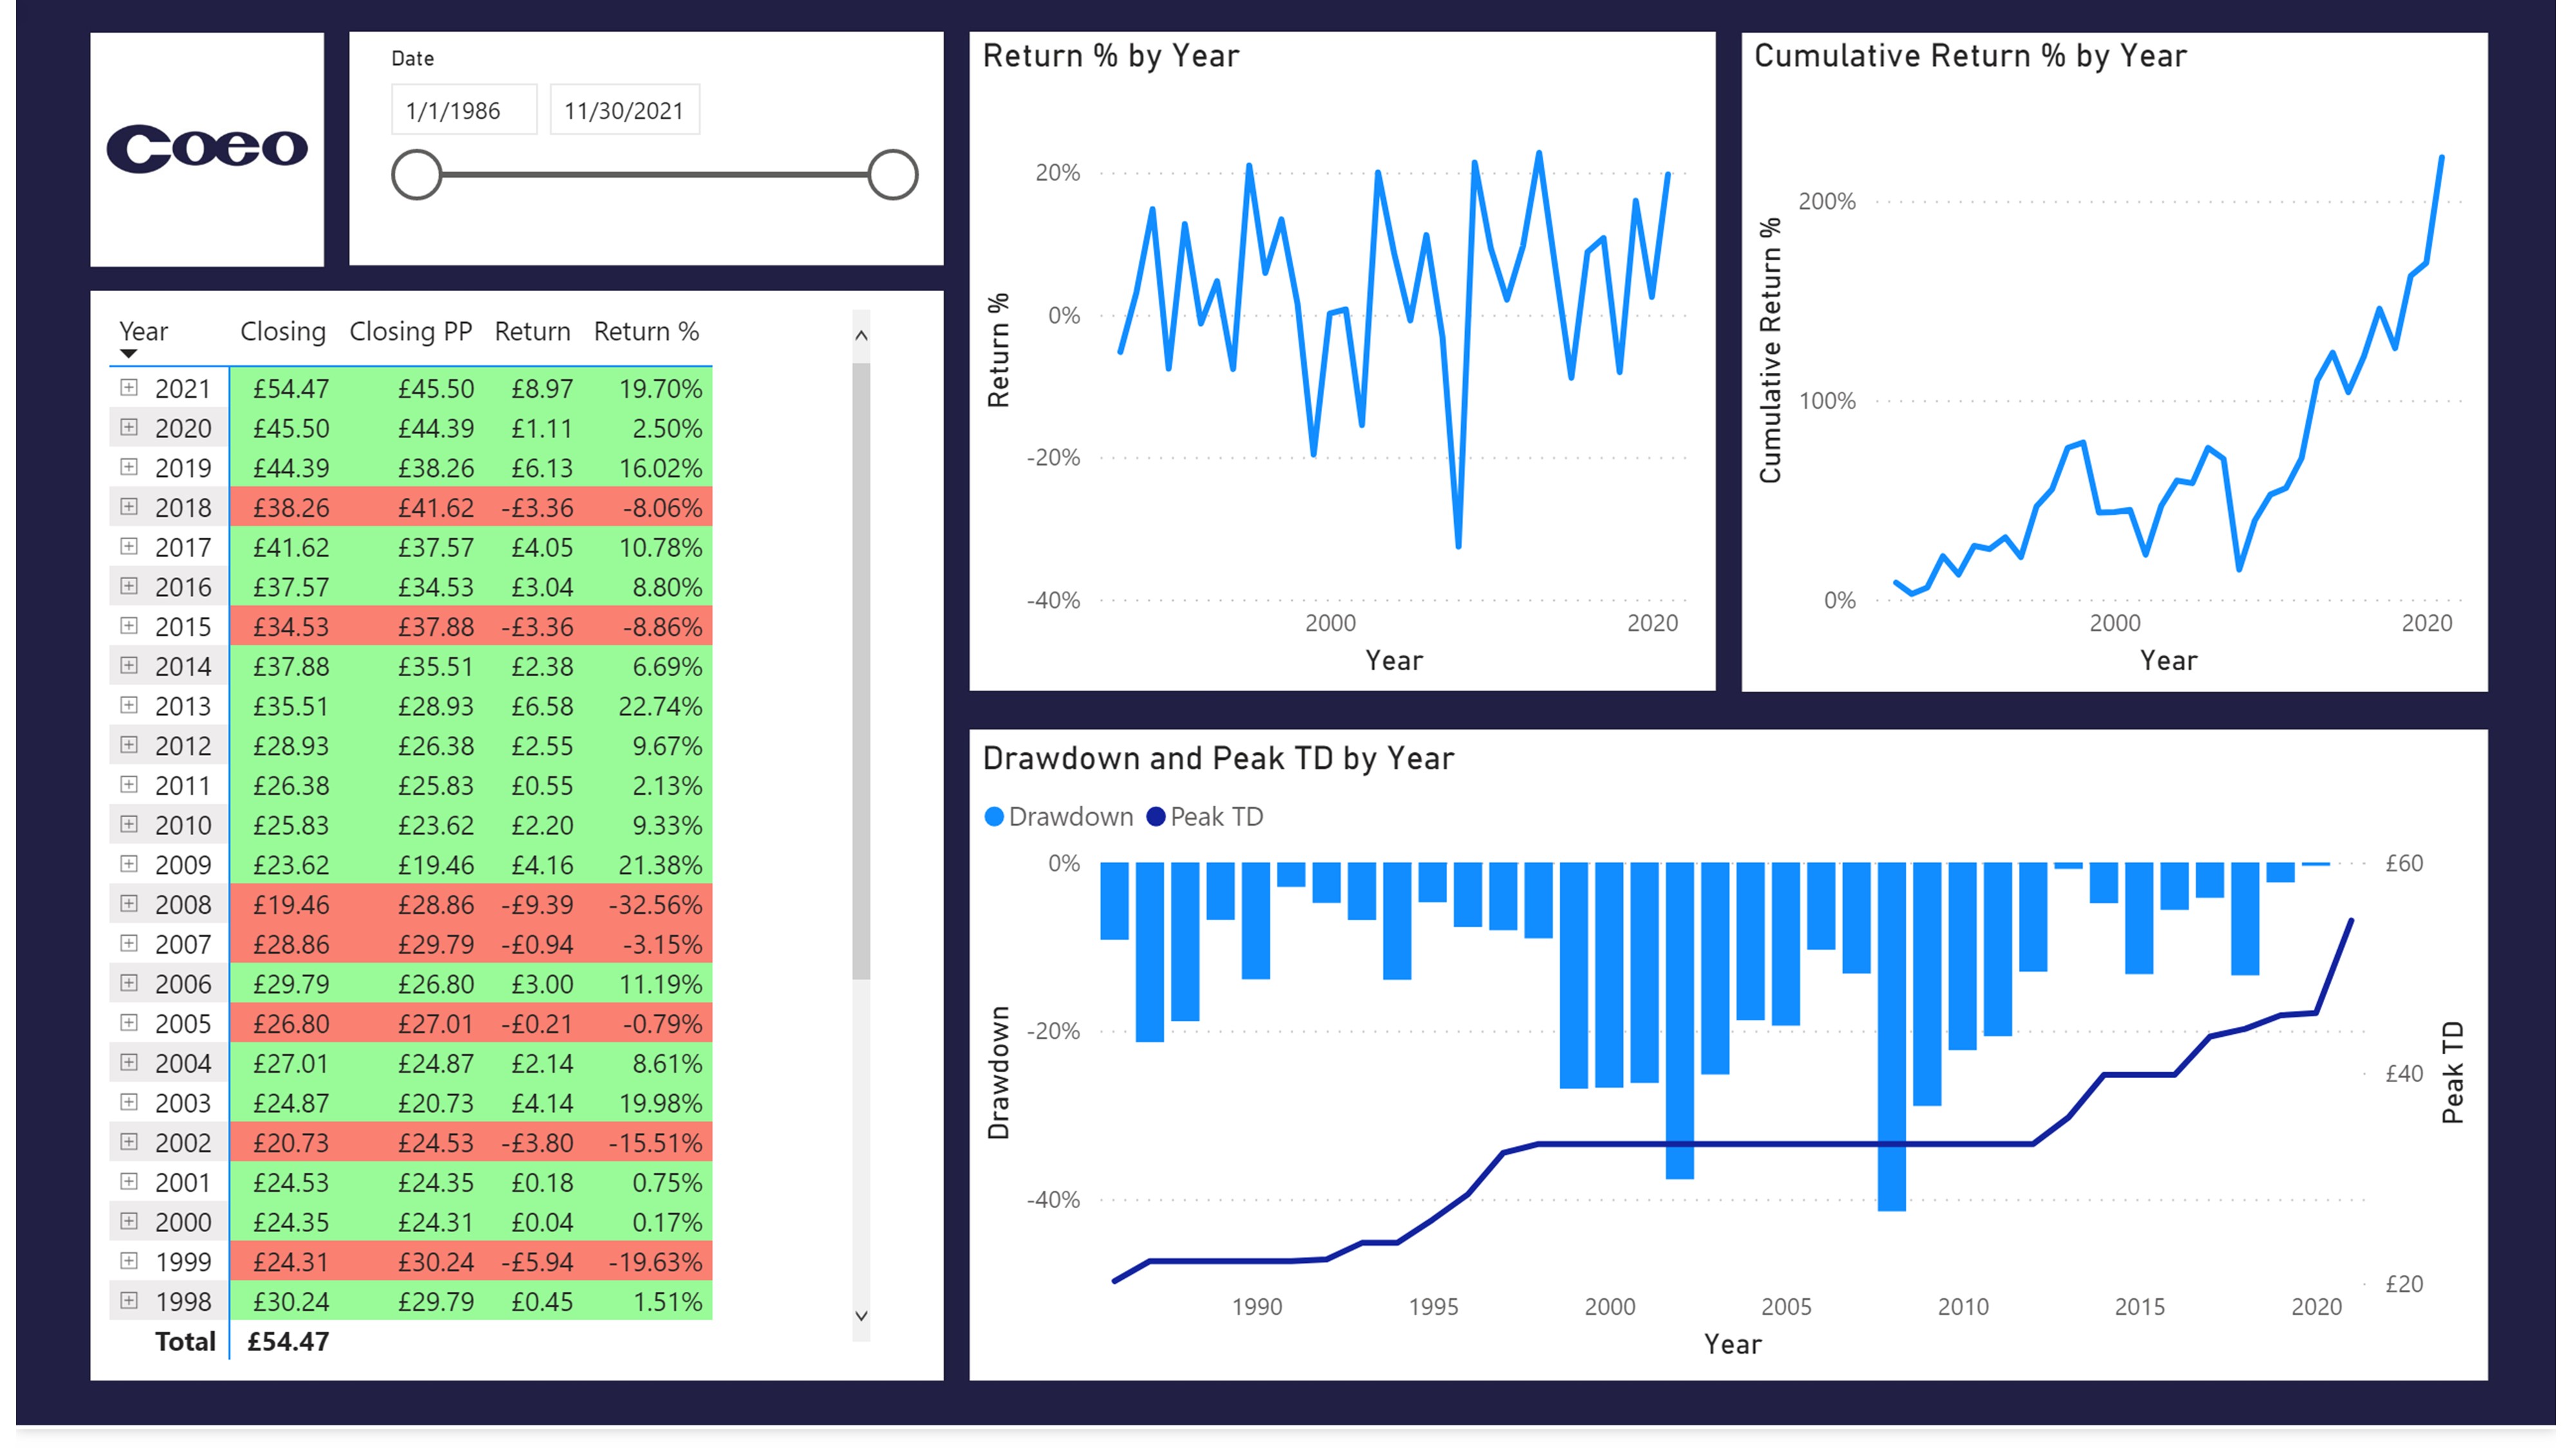
We have a snapshot of a fund value taken at a regular cadence. You want to measure success via criteria such as:
- Fund performance compared to the previous period.
- What is the value compared to the starting price.
- How does the current value compare to the peak value to date.
Facts
Power BI works best with a star-schema design. A full description of dimensional modelling techniques to create the star schema is too much for this post. However, the great thing is any dimensional modelling skills you have acquired with other tools and databases are still relevant. Coeo has a proven methodology to translate your business requirements into a flexible and high performing data model to support your Power BI reporting.
The "facts" are the numbers in your fact table. Think, transaction amount, fund value, profit and cost as examples. We have a column named "Close" on the "Fund Value" table in our example. Close (the closing value of the fund each day) is our fact.
Measures
Some simple Power BI reports display the raw facts from above. It is straightforward to get started with Power BI by dragging and dropping raw facts onto the reporting canvas, known as implicit measures. I don't recommend this approach and have written about it before at Get DRY with Power BI. Always create explicit measures to support code reuse and more complex logic than simple sums, counts and averages.
You create measures in Power BI using the DAX language. DAX is extremely powerful, best demonstrated with an example. Let's start with a simple measure:
Max of Close =
MAX('Fund Value'[Close])
The measure is called "Max of Close" and will display the maximum closing value of the fund. The beauty of Power BI is this will be the maximum value over any selection the user makes. For example, the user might want to see all data, one year of data or data for a particular fund. This feature is "filter context" in action, where the same measure works in all scenarios.
Simple measures work fine in many scenarios when the fact is fully-additive. By fully-additive, we mean we can sum the fact over any dimension and get a sensible mathematical answer. You will get your current balance if you add all your banking transactions since you opened your account. In this example, the transaction amount is fully-additive.
However, the closing value of a fund is a semi-additive measure. Adding up the daily closing fund values for one year makes no mathematical sense. However, you could sum the closing fund value for all funds to get a sensible business metric. Here is the DAX measure to give us the closing fund value over any period:
Closing =
VAR MaxCloseDate =
CALCULATE ( MAX ( 'Fund Value'[Date] ), ALLEXCEPT ( 'Fund Value', 'Date' ) )
VAR Result =
IF (
[ShowValueForDates],
CALCULATE ( [Max of Close], 'Date'[Date] = MaxCloseDate )
)
RETURN
Result
- The MaxCloseDate variable gives us the latest date in the current filter context.
- We achieve MaxCloseDate using the ALLEXCEPT function, which removes all user applied filters except for the crucial date column.
- The Result variable logic takes advantage of the CALCULATE function. CALCULATE is your friend and the function you will use more than any other. In this instance, we are constraining the closing value of the fund for the single date we identified above.
- If you're wondering above the "ShowValueForDates" part, this stops the report from displaying values for future dates in your date dimension.
This example shows the power of DAX, where the same measure will provide us with the closing fund value for a day, month, year or any period.
KPI
KPIs are your bespoke business metrics to measure the success of your business. We combine our measures above in creative ways to produce the desired output. For example, how did our closing value from this month compare to last? By combining our date dimension and filter context controls from above, we can easily find the closing value from the previous month (PM):
Closing PM =
VAR CurrentPeriod =
SELECTEDVALUE ( 'Date'[Year Month Number] )
VAR PreviousPeriod = CurrentPeriod - 1
VAR Result =
CALCULATE (
[Closing],
'Date'[Year Month Number] = PreviousPeriod,
REMOVEFILTERS ('Date')
)
RETURN
Result
We then calculate our month on month (MOM) value:
Closing MOM =
VAR ValueCurrentPeriod = [Closing]
VAR ValuePrevousPeriod = [Closing PM]
VAR Result =
IF (
NOT ISBLANK ( ValueCurrentPeriod ) && NOT ISBLANK ( ValuePrevousPeriod ),
ValueCurrentPeriod - ValuePrevousPeriod
)
RETURN
Result
And % difference:
Closing MOM % =
DIVIDE ( [Closing MOM], [Closing PM] )
We create similar measures to compare other periods such as day, quarter, and year, excluded here for brevity. The resultant KPIs allow us to create charts such as:
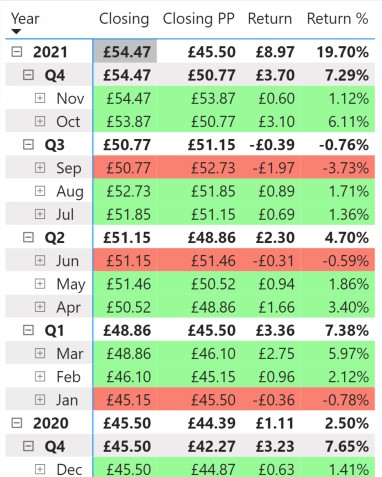
We added Power BI conditional formatting to give our users an immediate visual representation of our fund value month on month with growth months (positive return) in green with a month where the value drops (negative return) in red.
These KPIs are some examples of the many calculations available to us. You can see in the first screenshot we compare the current value to the starting price to give the cumulative return. We also calculate the peak value to date, allowing us to compare the current value to provide the drawdown value.
Goals
Here at Coeo, we use OKRs (Objectives and Key Results), which are measurable, time-bound and challenging targets to drive improvement. A more recent addition to the excellent reporting capabilities of Power BI is Goals. Goals allow you to track all your OKRs in a single place within the Power BI cloud service.
Here is a screenshot of some of my goals from the finance example.
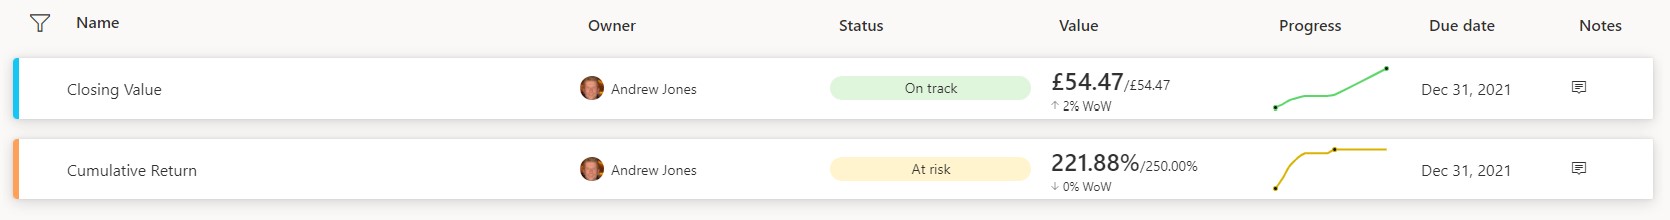
Goals provide you with a bird's eye view of your whole business with colour coding to show progress towards target and areas of concern requiring your immediate attention.
The Microsoft Ignite 2021 conference announced integration between Power BI goals and Power Automate. This enhancement takes things to the next level, allowing you to automate and trigger actions based on goal values. For example, you might email a distribution group when a Goal is at risk.
Power BI Goals are a Premium feature. At Coeo, we are now seeing many more customers using Premium due to the per-user licensing option. Goals are one example of the many extra reporting possibilities that Power BI Premium provides.
Closing
Follow the four Ms process to measure your business and set your Power BI reporting up for success to drive process improvement throughout the company:
- Model – create a star-schema design including facts.
- Measure – develop measures using the DAX language.
- Mix – mix measures to implement your KPIs.
- Mission – define your mission and targets? Create Power BI goals to track your progress.