
Save yourself time working with Power BI.
Don't repeat yourself (DRY) (https://en.wikipedia.org/wiki/Don%27t_repeat_yourself) is to avoid duplicating effort. Power BI offers opportunities to be WET ("write everything twice", "we enjoy typing" or "waste everyone's time"), five ways to get DRY with Power BI.
1: Single semantic layer
Create a single semantic layer.
Power BI report writers interact with the semantic layer to produce visualisations. A semantic layer has the properties:
- Hides data sources
- Hides table relationships
- User-friendly names
- Measures
- Data types
- Formatting
- Summarisation
Do you have a wild-west scenario where people publish independent datasets to Power BI, reporting the same data? You will get these problems:
- Duplicate storage
- Different name, same measure
- Different measure, same name (include preview screening in “Opening Weekend Box Office Revenue” or not)
- Bug fixes duplicated
- Overload sources with refreshes
SOLUTION: Design a single semantic layer using Power BI or Azure Analysis Services.
Power BI:
- Publish app 1. Connect, cleanse, relate, add measures but don’t visualise.
- Everyone else connects to app 1 using live connection (Get Data | Online Services | Power BI service).
Azure Analysis Services:
- Publish to Azure Analysis Services (use SQL Server Data Tools or import Power BI desktop file).
- Connect to Azure Analysis Services using live connection (Get Data | Azure | Azure Analysis Services database).
- You now have partitions, incremental refresh, perspectives, KPI measures, ability to pause, source control, more storage, region choice, and your choice of reporting tools.
2: Row-level security
Add row-level security to save hours.
Row-level security allows you to release the same Power BI content, only exposing a filtered slice to each user. The cumbersome alternative is to duplicate reports for each department.
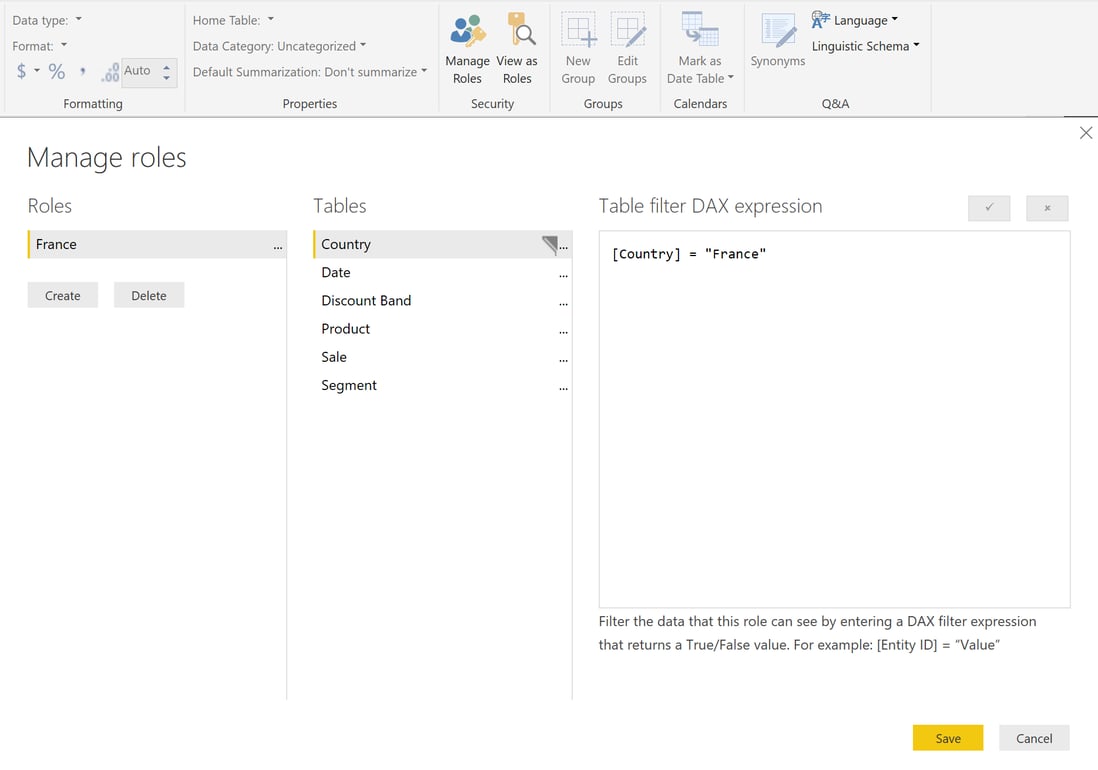
Hit manage roles to add Power BI row-level security:
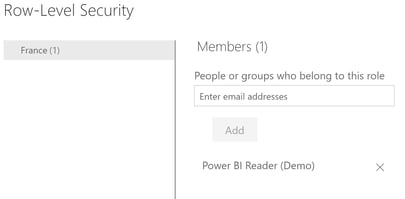
You then add users to roles in the service:
Add row-level security to Azure Analysis Services and not Power BI if row-level security needs to apply to report creators. Row-level security is by-passed by having edit permissions on an app workspace in the Power BI service or by using Power BI desktop.
SOLUTION: Add row-level security to Azure Analysis Services. You then apply row-level security to report readers, report creators, and all reporting tools not just Power BI.
3: Import folders not files
Think folders, not files when importing customer feedback csv files or monthly sales Excel spreadsheets.
Power BI has a data transformation tool built-in. Import many files of similar structure as a single entity.
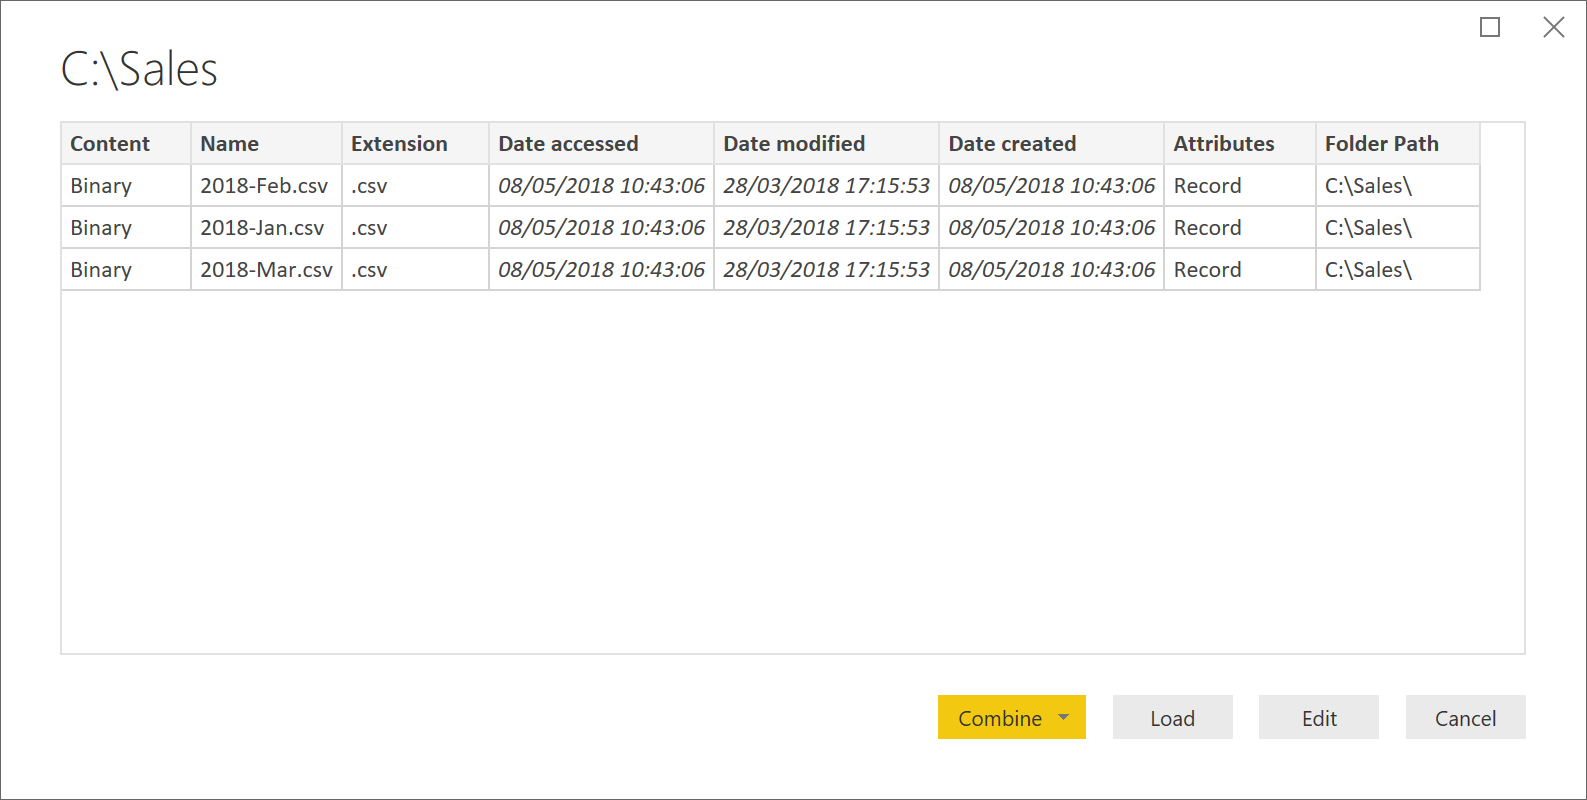
SOLUTION: Import a folder (Get Data | Folder). Hit the combine button to append all files into a single table. Apply further transformations and report on the data as a whole.
Your solution even imports from sub-folders and files added in the future. You make huge time savings when adding this automation.
4: Explicit DAX measures
Use explicit not implicit measures.
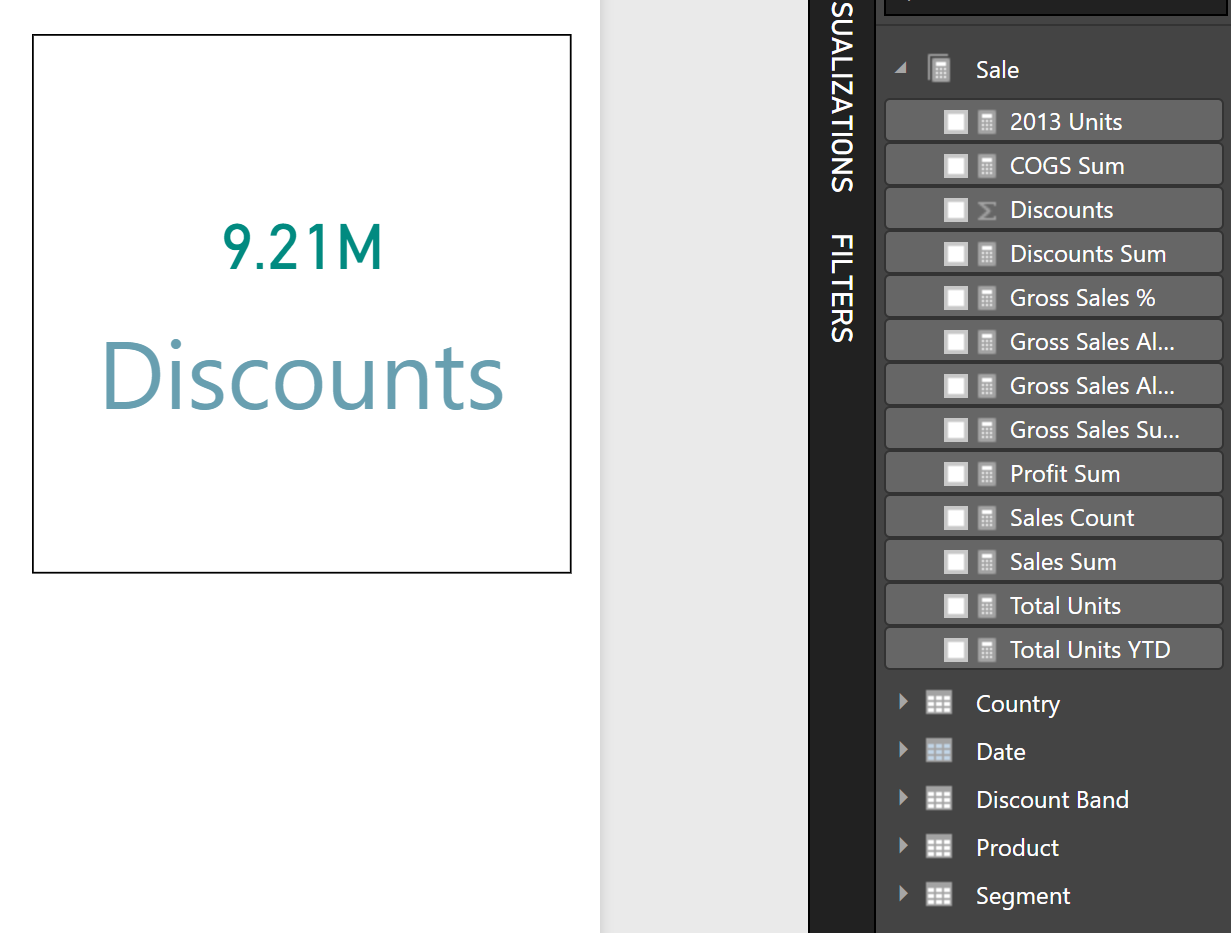
Using implicit measures in Power BI is possible. An example is the Discounts column in the Sales table below. You drag Discounts (Sigma icon) on to the reporting canvas to visualise it on a card.
Implicit measures have the following limitations:
- Automatic label
- Formatting wrong
- Basic mathematical aggregations only
- Don’t work with “Analyze in Excel”
- Repeating logic
The last point is very important and worth an example. Sales = Gross Sales - Discounts, we create a DAX measure for this:
Sales Sum WET = SUMX(Sale,Sale[Units Sold] * Sale[Sale Price]) - SUM(Sale[Discounts])
Alternatively, we define explicit measures for each part:
Gross Sales Sum = SUMX(Sale,Sale[Units Sold] * Sale[Sale Price])
Discounts Sum = SUM(Sale[Discounts])
Now our Sales measure is:
Sales Sum = [Gross Sales Sum] - [Discounts Sum]
[Discounts Sum] is now defined once, and used everywhere.
Define the logic for each measure at a single location. Any change is done once and flows throughout your application.
SOLUTION: Create explicit DAX measures. Assign an unambiguous name, apply formatting and use the full power of DAX to create more complex measures. Reference measures in other measures to encapsulate logic in a single location. You make future bug fixes or change requests in one place, truly matching our requirements not to repeat ourselves.
5: Add columns at source
Don’t add DAX calculated columns (unless you have to).
You can add DAX calculated columns when the attribute does not exist at the source. Examples:
- Is the date a bank holiday
- Is the date a weekend
- Five-year customer age bracket
- Was the sale discounted
Calculated columns are not DAX measures. Always create a measure when performing an aggregation. Calculated columns are computed at data refresh and stored in the data model.
Change the data source to add the column where possible. Add a table column or update an abstraction layer view adding the attribute. The column is now available for all and logic does not have to be repeated.
Data compression is also more efficient when importing a column rather than adding via DAX.
SOLUTION: Add a required column at the source. You define this logic once, allowing its use everywhere in any reporting tool. You achieve better storage compression and don’t have to repeat logic. Go ahead and add using DAX if you don’t have source permissions and any alternative.
Summary
Business intelligence solutions are not fire-and-forget. They evolve and the following change:
- User count
- Data sources
- Data location
- Measure logic
- Model size
- Reporting tool
- Refreshes per day
- Security
- Report authors
- Regulations
- Maintenance window
You will be making regular changes, so make your life easy. Use the five points in this post to design a flexible solution that is a pleasure to maintain.
