
At Coeo, we have the opportunity to deal with a wide range of problems every day and sometimes they manifest in mysterious ways.
Working on a customer's environment, we observed that some databases hadn't run CHECKDB for longer than scheduled, so we rolled our sleeves up to find out why.

Initial findings
Upon investigation, we saw the maintenance job that runs the Integrity Checks was taking unusually long, sometimes several days, even for small system databases, making the job overrun following executions.
Running some diagnostic queries, we could see that more or less every query that was executed on this server was reporting the wait type RESOURCE_SEMAPHORE, which made us believe we might be dealing with a memory issue.
First things first, we started by reviewing the server resources and its configuration, which were as follows:
- Single instance of SQL Server 2008 R2 Standard Edition with 4 processors and 16GB of memory
- Max Server Memory was configured to 12GB.
On paper, even though it's not a beefy server, it seems configured appropriately and running queries shouldn't be a problem.
Memory requirements
Each query we submit to a SQL Server will require memory to be executed. SQL Server will evaluate the query requirements and grant the requested memory before it can start running.
In order to find out more about why our server was always making queries wait for memory we ran a couple of diagnostic queries, as follows:
SELECT *
FROM sys.dm_exec_query_resource_semaphores

SELECT *
FROM sys.dm_exec_query_memory_grants
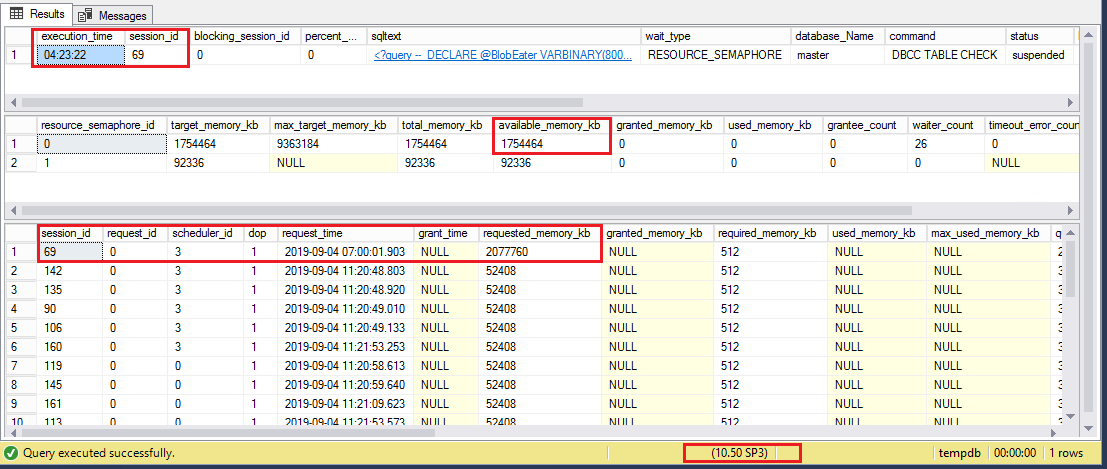
You can see that our DBCC CHECKDB had been running for longer than 4 hours and the requested memory was just about 2GB, but the semaphores had only 1.7GB and 92MB respectively.
Until the semaphore had enough memory available for our query this needed to wait and sometimes, as I said earlier, it took around 24 hours for a small system database like [master].
Diving into the SQL Server's memory
But, if we saw there are 16GB present on the server and 12GB allocated to SQL Server, where is all this memory allocated?
The SQL Server buffer pool is normally the biggest consumer as data always needs to be read into memory first and is kept there as long as possible to minimise the performance penalty associated to IO operations.
If you want to see which database is the biggest memory consumer in your SQL Server, you can run the following query, which will also give you the total in MB of memory used in the buffer pool.
SELECT count ( * ) * 8/1024 AS 'Cached Size (MB)'
    ,CASE database_id
        WHEN 32767 THEN 'ResourceDb'
        ELSE db_name(database_id)
        END AS 'Database'
FROM sys.dm_os_buffer_descriptors
GROUP BY database_id
WITH ROLLUP
ORDER BY 'Cached Size (MB)' DESC
I'll not publish the result of this query, but I can tell you that the buffer pool was unusually empty for a system that is starved of memory.
The buffer pool, however, is not the only SQL Server component that needs memory to function and we can see the distribution by looking at the different memory clerks.
We can find the top five consumers using the following query:
SELECT TOP(5) type
		, name
		, SUM(single_pages_kb) / 1024 AS single_pages_mb
		, SUM(multi_pages_kb) / 1024 AS multi_pages_mb
		, SUM(virtual_memory_reserved_kb) / 1024 AS virtual_memory_reserved_mb
		, SUM(virtual_memory_committed_kb) / 1024 AS virtual_memory_committed_mb
		, SUM(awe_allocated_kb) / 1024 AS awe_allocated__mb
FROM sys.dm_os_memory_clerks
GROUP BY type
		, name
ORDER BY single_pages_mb DESC
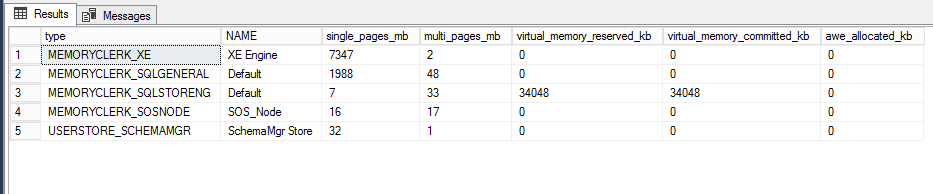
In our case, the biggest consumer was MEMORYCLERK_XE with a bit more than 7GB, followed by MEMORYCLERK_SQLGENERAL with around 2GB.
That was very revealing as we found where most of the memory was "used".
Fixing the problem
Once we knew the MEMORYCLERK_XE was responsible for our issues we looked at current Extended Events sessions currently running on the server:
SELECT *
FROM sys.server_event_sessions AS s
INNER JOIN sys.dm_xe_sessions AS xe
ON xe.name = s.name
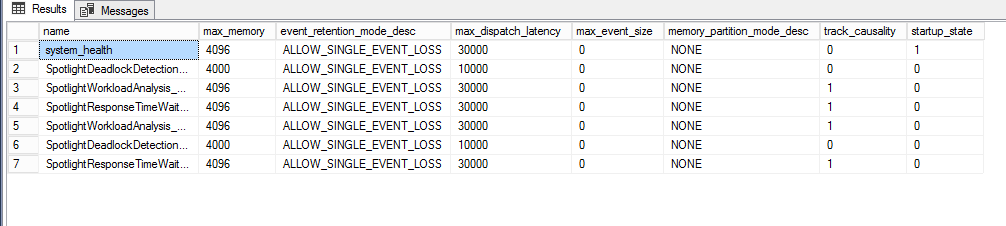
So, there were six extended event sessions running on the server that might explain the memory usage, but as they were defined, they're allowed to use a max of 4MB each, so there's still some knots to untie.
We stopped the XE sessions, but the memory wasn't released as expected and the memory clerk was still consuming +7GB, so we kept trying to find the solution.
Finally we found the "solution" in this Microsoft KB Article, which wasn't for SQL Server 2008 R2 but for SQL Server 2012, although it matched the behaviour.
Since it seems this fix was never back-ported to 2008 R2 and as this version is out of support, we had no other choice but schedule a restart to fix the issue.
Conclusion
Sometimes SQL Server issues can reveal themselves in unexpected ways, so we need to be aware and have a broad perspective not to jump to a knee-jerk reactive approach to fix our customers' issues.
Also it's worth mentioning the risks of running unsupported versions of SQL Server, as issues like that won't be fixed and should it happen again, we will need to schedule another restart with the consequent downtime.
Hope you enjoyed this post and let me know if you have any questions in the comments below.
Thanks for reading.
