
Capturing baselines
Capturing baselines seems to be a hot topic in SQL Server land at the moment. So I thought I’d write a post on how I do it.
When I first looked at doing this I read this post from Brent Ozar http://www.brentozar.com/archive/2006/12/dba-101-using-perfmon-for-sql-performance-tuning/ . So taking the list of counters he suggests I decided I’d look to see if there was a way that I could automate a system whereby I capture the stats and then import them into a database for analysis. Initially I was going to write an SSIS package to import the CSV’s into a database, however when I was playing around with perfmon I noticed that you can infact import the data straight into SQL Server. And this is how you do it:
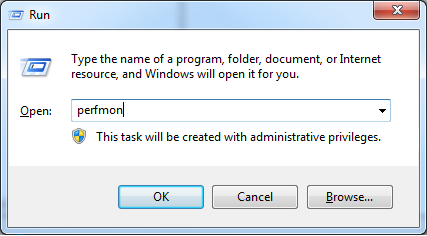
Start perfmon by going to Start > Run > perfmon
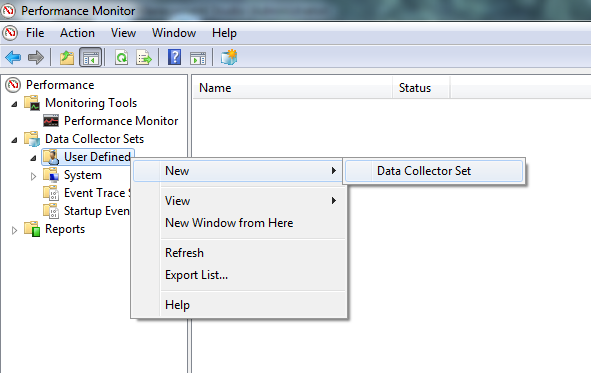
Create a new collection set set
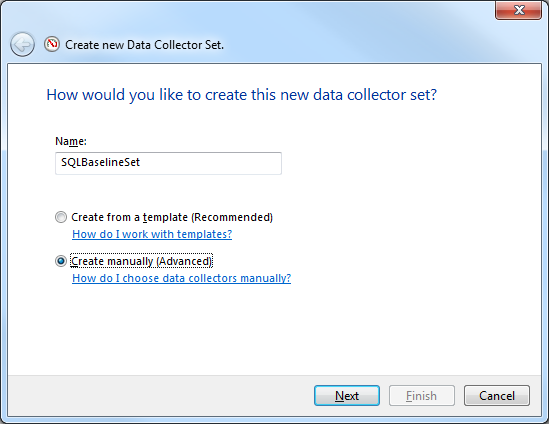
Give the set a name
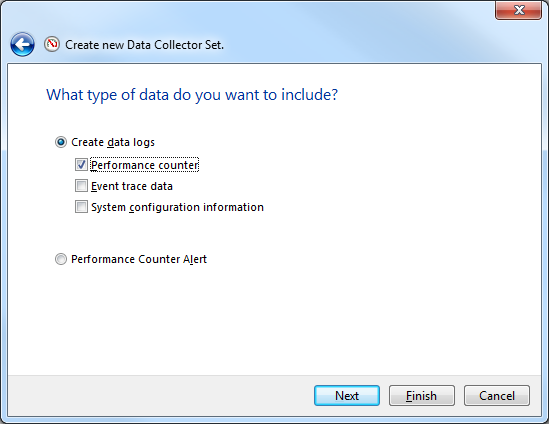
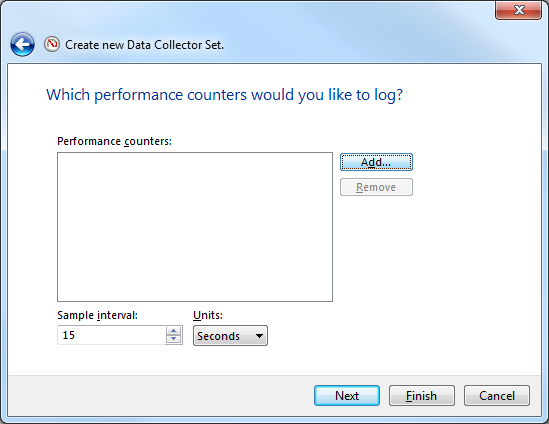
Select the type of data we want to add (performance counters)
Click add
Add the counters using the dialog
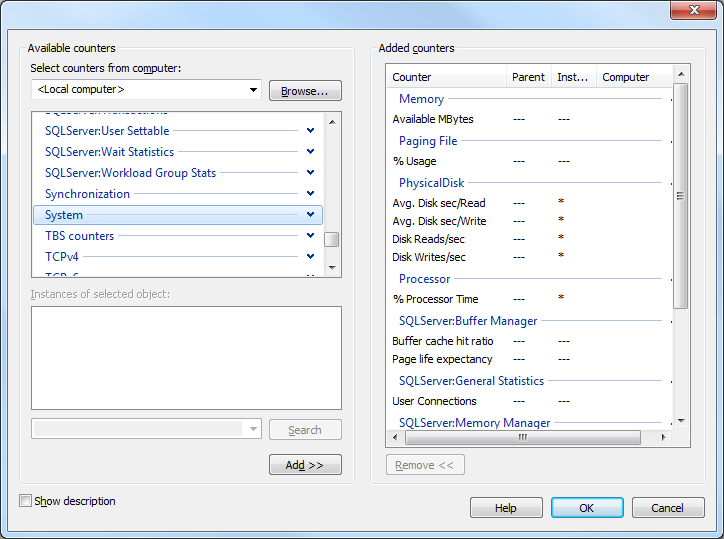
When finished adding counters click OK. Then click next to carry on with the wizard.
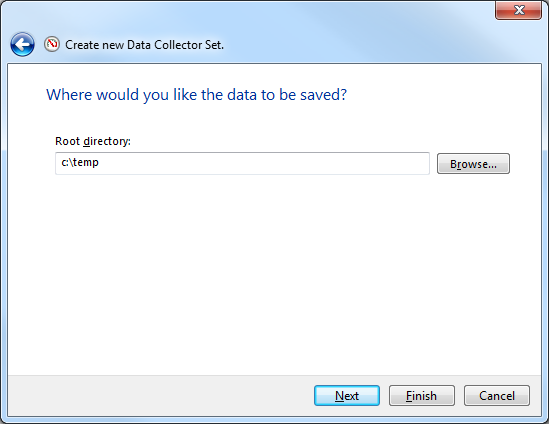
Specify a dummy directory for storing the output (we’re going to change this in a bit).
Specify the user that the collector runs as (I believe they need to be a local admin).
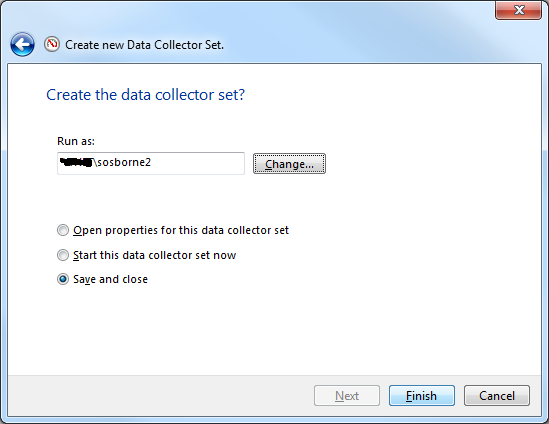
Finally click finish and you set should be created.
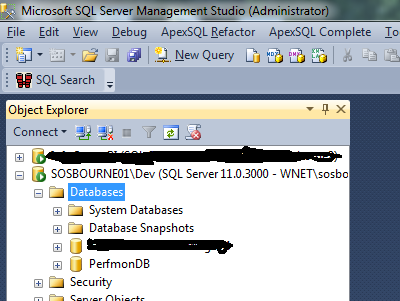
Next we need to setup an odbc connection so that perfmon can insert the information into our database. I’ve setup a DB called perfmon DB on a dev instance for the purposes of this post
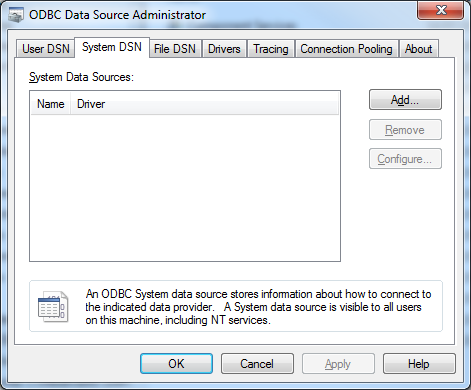
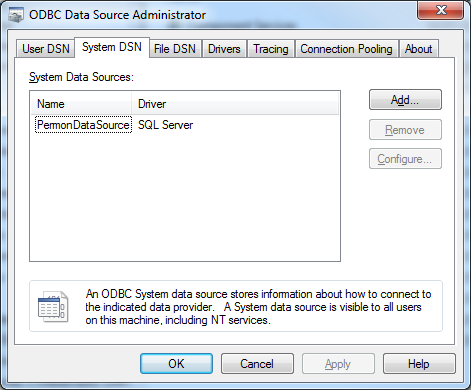
Go to Control Panel > Admin Tools > Data Sources (ODBC) and then click on the system DSN tab.
Click Add
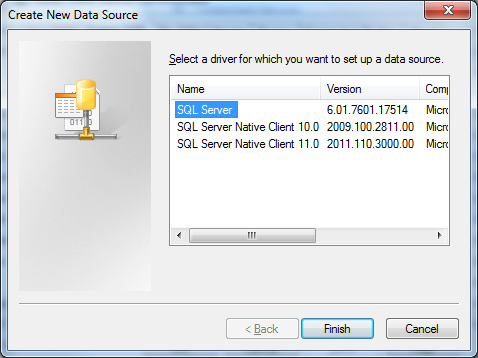
I select SQL Server, I’ve had permissions problems setting up an ODBC connection with the Native Clients that I was unable to resolve at the time of writing…
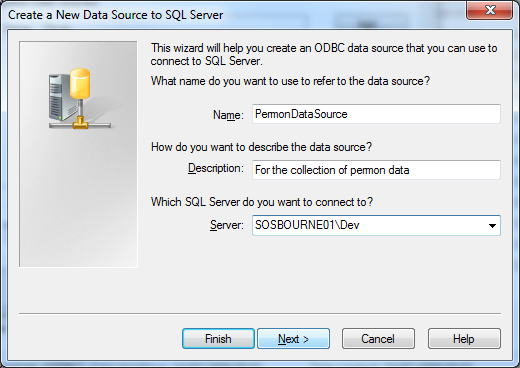
Give the DSN a name and description, and specify the server you want to write the data to.
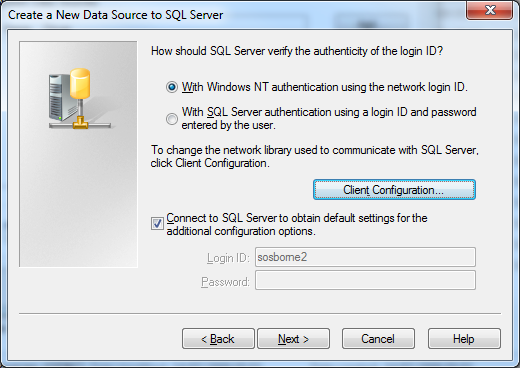
Specify the credentials to login to the server
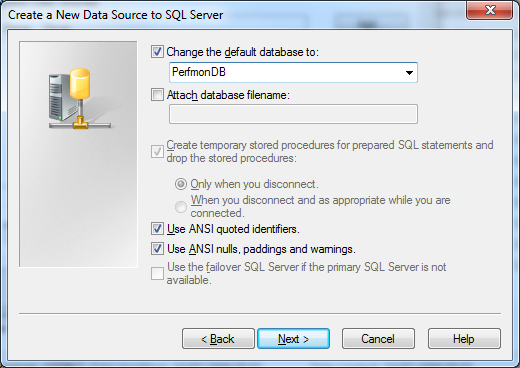
Specify the database we’re going to store the info in
Final options for the DSN
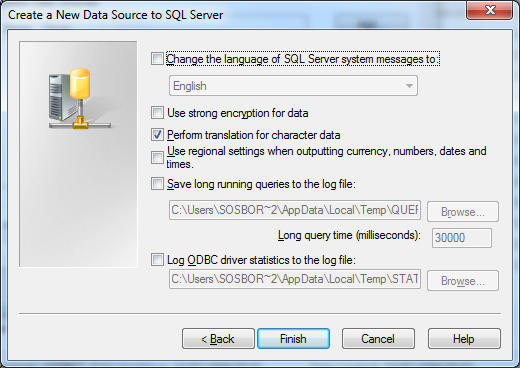
And that should be the DSN created once you click finish
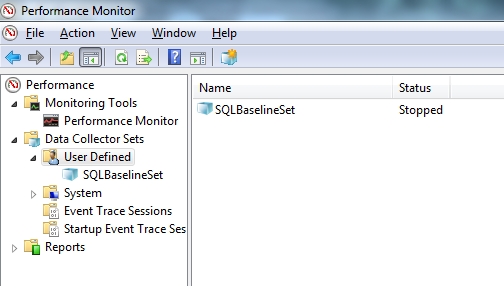
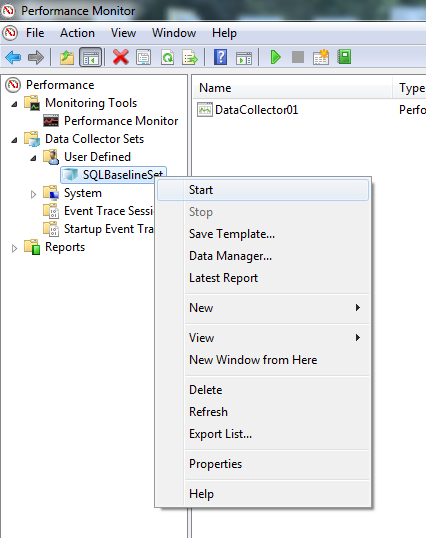
Return to the perfmon screen and highlight your SQLBaselineSet
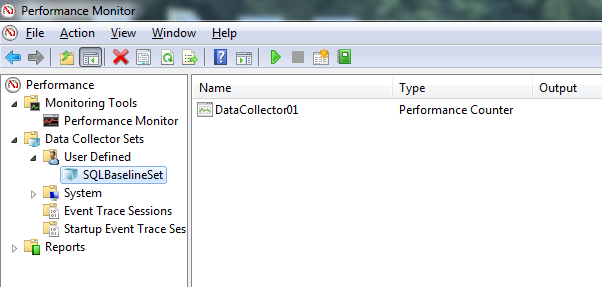
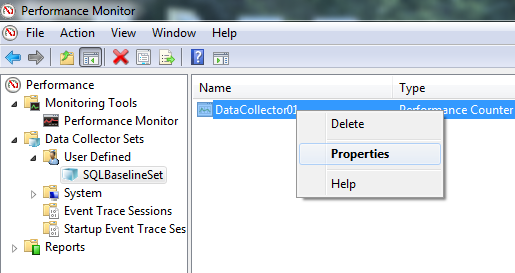
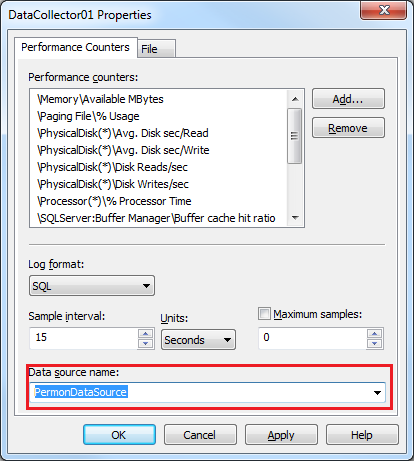
Go to the properties of the Data Collector 01
Change the logging type from Binary to SQL
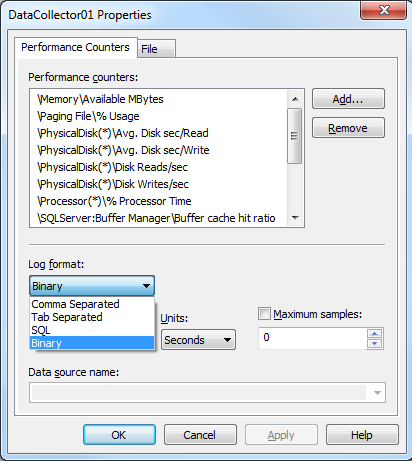
Specify the DSN we created in the bottom drop down box and click ok
The only things that remains really is to start the logging!
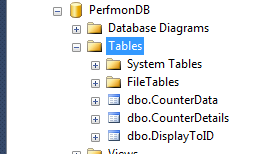
After you’ve started the logging, assuming all your permissions are set correctly for the DSN user etc. you should get 3 tables in your database
What I did after this was to look at the tables and create a view that would allow for better interpretation of the data. Code below by way of an example. If you used different counters then you’ll have to adjust the code accordingly.
CREATE VIEW [dbo].[PerfCounters]

 AS

 SELECT

 cd.CounterDateTime,

 MAX(CASE WHEN cde.CounterID = 1 THEN CounterValue END) AS [Available MBytes],

 MAX(CASE WHEN cde.CounterID = 10 THEN CounterValue END) AS [% Usage\??C:pagefile.sys],

 MAX(CASE WHEN cde.CounterID = 11 THEN CounterValue END) AS [% Usage_Total],

 MAX(CASE WHEN cde.CounterID = 12 THEN CounterValue END) AS [Avg. Disk sec/Read\0 C: E: D:],

 MAX(CASE WHEN cde.CounterID = 13 THEN CounterValue END) AS [Avg. Disk sec/Read1 G:],

 MAX(CASE WHEN cde.CounterID = 14 THEN CounterValue END) AS [Avg. Disk sec/Read_Total],

 MAX(CASE WHEN cde.CounterID = 15 THEN CounterValue END) AS [Avg. Disk sec/Write\0 C: E: D:],

 MAX(CASE WHEN cde.CounterID = 16 THEN CounterValue END) AS [Avg. Disk sec/Write1 G:],

 MAX(CASE WHEN cde.CounterID = 17 THEN CounterValue END) AS [Avg. Disk sec/Write_Total],

 MAX(CASE WHEN cde.CounterID = 18 THEN CounterValue END) AS [Disk Reads/sec\0 C: E: D:],

 MAX(CASE WHEN cde.CounterID = 19 THEN CounterValue END) AS [Disk Reads/sec1 G:],

 MAX(CASE WHEN cde.CounterID = 2 THEN CounterValue END) AS [Buffer cache hit ratio],

 MAX(CASE WHEN cde.CounterID = 20 THEN CounterValue END) AS [Disk Reads/sec_Total],

 MAX(CASE WHEN cde.CounterID = 21 THEN CounterValue END) AS [Disk Writes/sec\0 C: E: D:],

 MAX(CASE WHEN cde.CounterID = 22 THEN CounterValue END) AS [Disk Writes/sec1 G:],

 MAX(CASE WHEN cde.CounterID = 23 THEN CounterValue END) AS [Disk Writes/sec_Total],

 MAX(CASE WHEN cde.CounterID = 3 THEN CounterValue END) AS [Page life expectancy],

 MAX(CASE WHEN cde.CounterID = 4 THEN CounterValue END) AS [User Connections],

 MAX(CASE WHEN cde.CounterID = 40 THEN CounterValue END) AS [% Processor Time_Total],

 MAX(CASE WHEN cde.CounterID = 5 THEN CounterValue END) AS [Memory Grants Pending],

 MAX(CASE WHEN cde.CounterID = 6 THEN CounterValue END) AS [Batch Requests/sec],

 MAX(CASE WHEN cde.CounterID = 7 THEN CounterValue END) AS [SQL Compilations/sec],

 MAX(CASE WHEN cde.CounterID = 8 THEN CounterValue END) AS [SQL Re-Compilations/sec],

 MAX(CASE WHEN cde.CounterID = 9 THEN CounterValue END) AS [Processor Queue Length]

 FROM

 counterdata cd

 JOIN dbo.CounterDetails cde ON cd.CounterID = cde.CounterID

 GROUP BY

 cd.CounterDateTime
Which should allow for queries like this
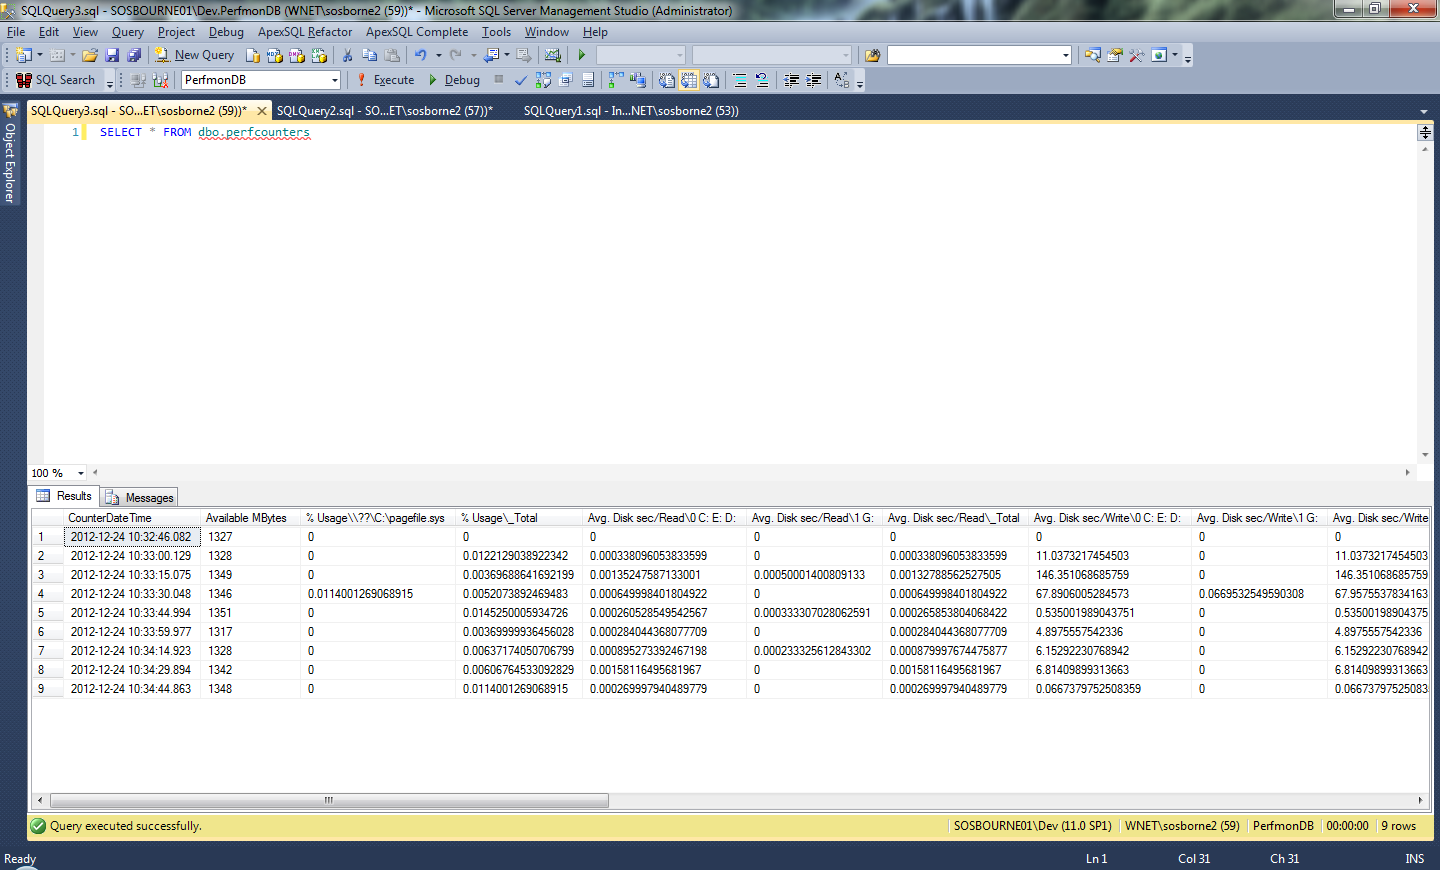
What you do from here is up to you but I hope you’ve found this useful.

![]()