
In the modern data market we're bombarded by advice on how to set up our tech to last the test of time and be perfect. While that is admirable and very important for reports used by a wide audience it is important to keep in mind that Power BI is also useful for small-scale personal use and to prototype larger projects.
Perhaps you only have a small data set and only yourself or very few people even interested in that data. You think your data is useful but others fail to see the diamond in the rough. Just because it has a small audience (you) it's not to say that you can't leverage Power BI. This is something I've personally found very useful.
BI projects can sometimes be quite intimidating and it feels like they need to be perfect first time. It takes many years of experience to get close to that and so as a first timer start small: don't try to swallow the elephant whole.
Large BI transformation projects require decisions to be made around licencing, deployment techniques and large scale data modelling, which can understandably take months and that is very difficult to get buy-in for. Spending a few hours creating a small proof of concept can help warm coworkers or your boss to Power BI, and get them thinking what lessons their data can teach them. Worst case scenario it's only you that attains any useful insights from it and you've learnt some useful BI skills in the process.
I recently had one such project where I was gathering data around nominations for an internal award and I wasn't satisfied with just my Excel sheet.
For the small quantity of data I was working with and the infrequency of data being added, manual entry with Excel was sufficient/appropriate. While some may look down on Excel as a data source, even in large enterprises it's used to store and share vital business data and so will still have its place for a loooong time. The main limitation to keep in mind with an Excel data source however is that your Power BI dataset cannot be refreshed from that data if the document is open. So if your colleague Dave enters some data and then goes on holiday without closing it, you're going to have problems.
Aside from neatness, a nice time-saver is putting your data in a table rather than just rows:
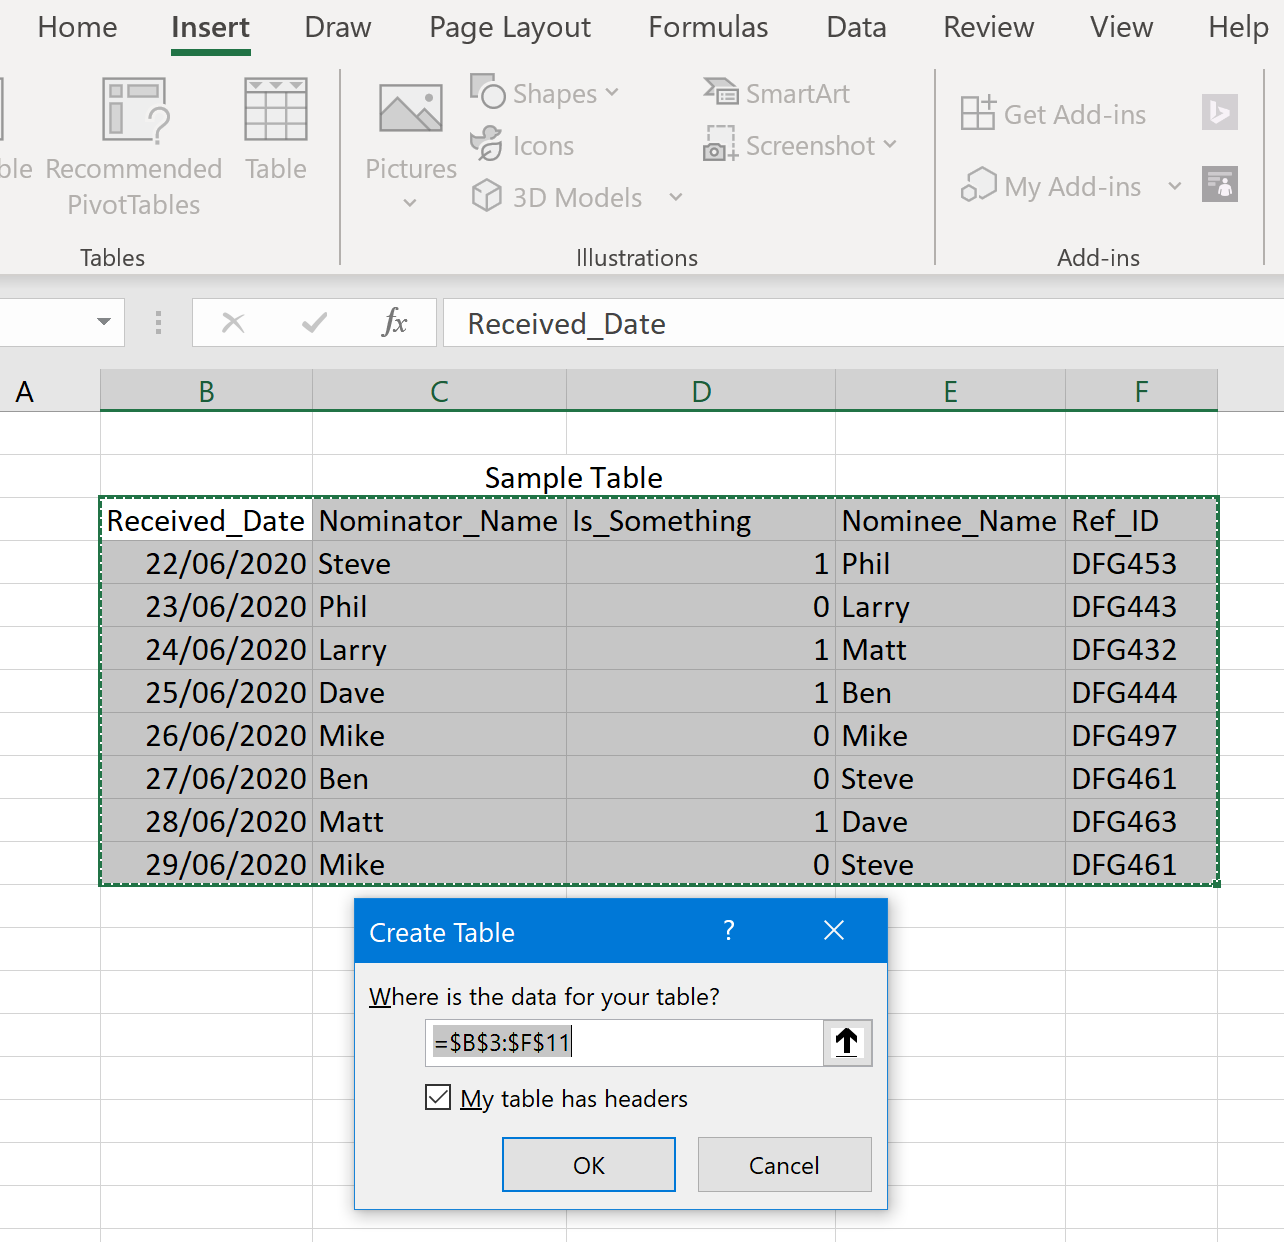 This allows the clever Power BI to identify column names and ignore extraneous data. For example a table allows me to have the title "Sample Table" above it without that title being interpreted as data by Power BI as it knows to only look within the specific cells of that table.
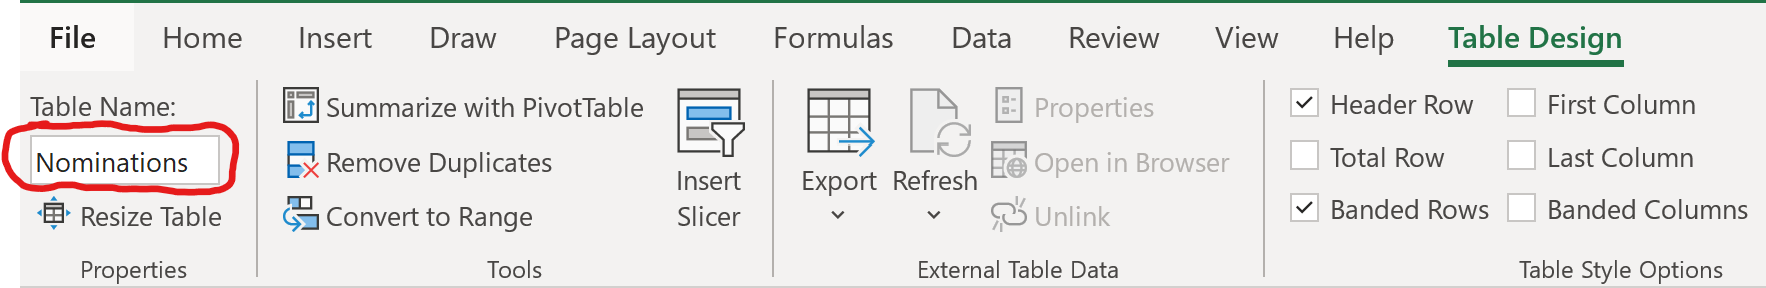
For your own future sanity, it's also worth naming your table something useful/appropriate as this is displayed when you pull your data into Power BI and avoids identifying "Table1, Table2, Table3" when you need to make changes:
After creating it, I downloaded, opened up and signed in to my copy of Power BI Desktop and selected "Get Data". You could use the web version but there are a few more features to the desktop version that personally makes it feel worthwhile. You can also only download the report file and open it in Power Bi desktop if the report was originally created in the Desktop client.
If you are using Excel for your proof of concept/personal report then the whole sheet can be imported or specific tables (as above) but there are a huge number (130+) of different data sources so everything from 3rd party apps to R scripts to terradata to AAS to text files are all up for grabs. The only limit is your data.
As you import your tables there's a nice refresh button:
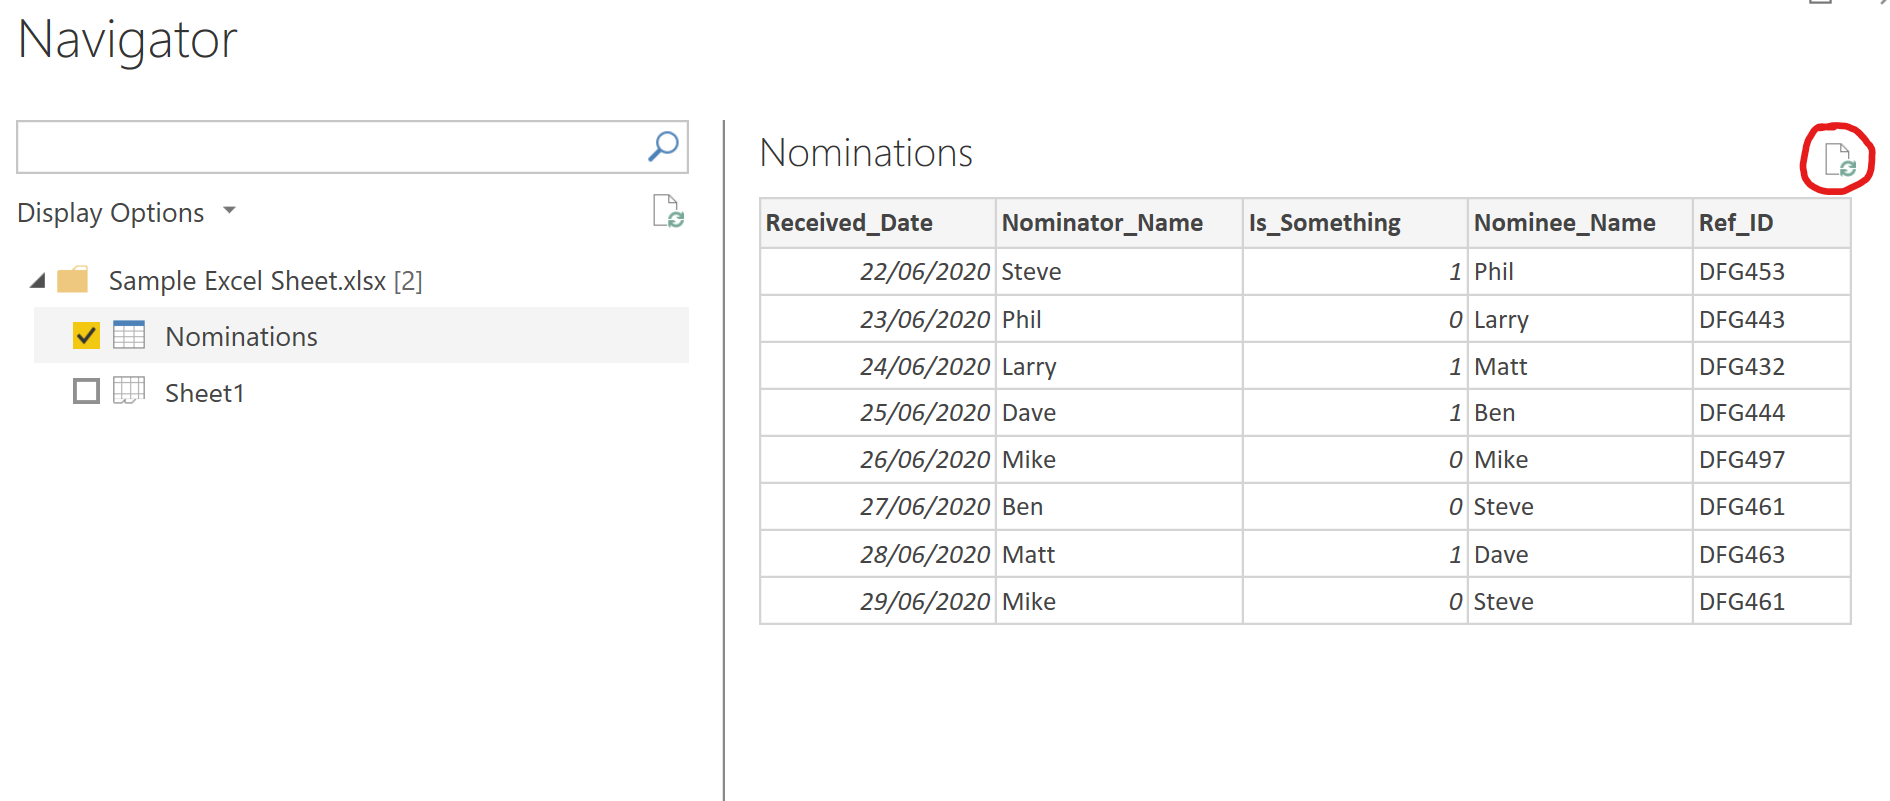
This means that if you notice anything "off" about your data (a misspelled column for example) you can easily change it and hit refresh 'til you're happy. As soon as I began to import my data I also began to realise that I wasn't capturing nearly enough. This was just a simple case of adding my additional columns in Excel, saving and then refreshing in Power BI until I was happy. I threw together a few basic visuals on a report and could already begin to see patterns in my data:
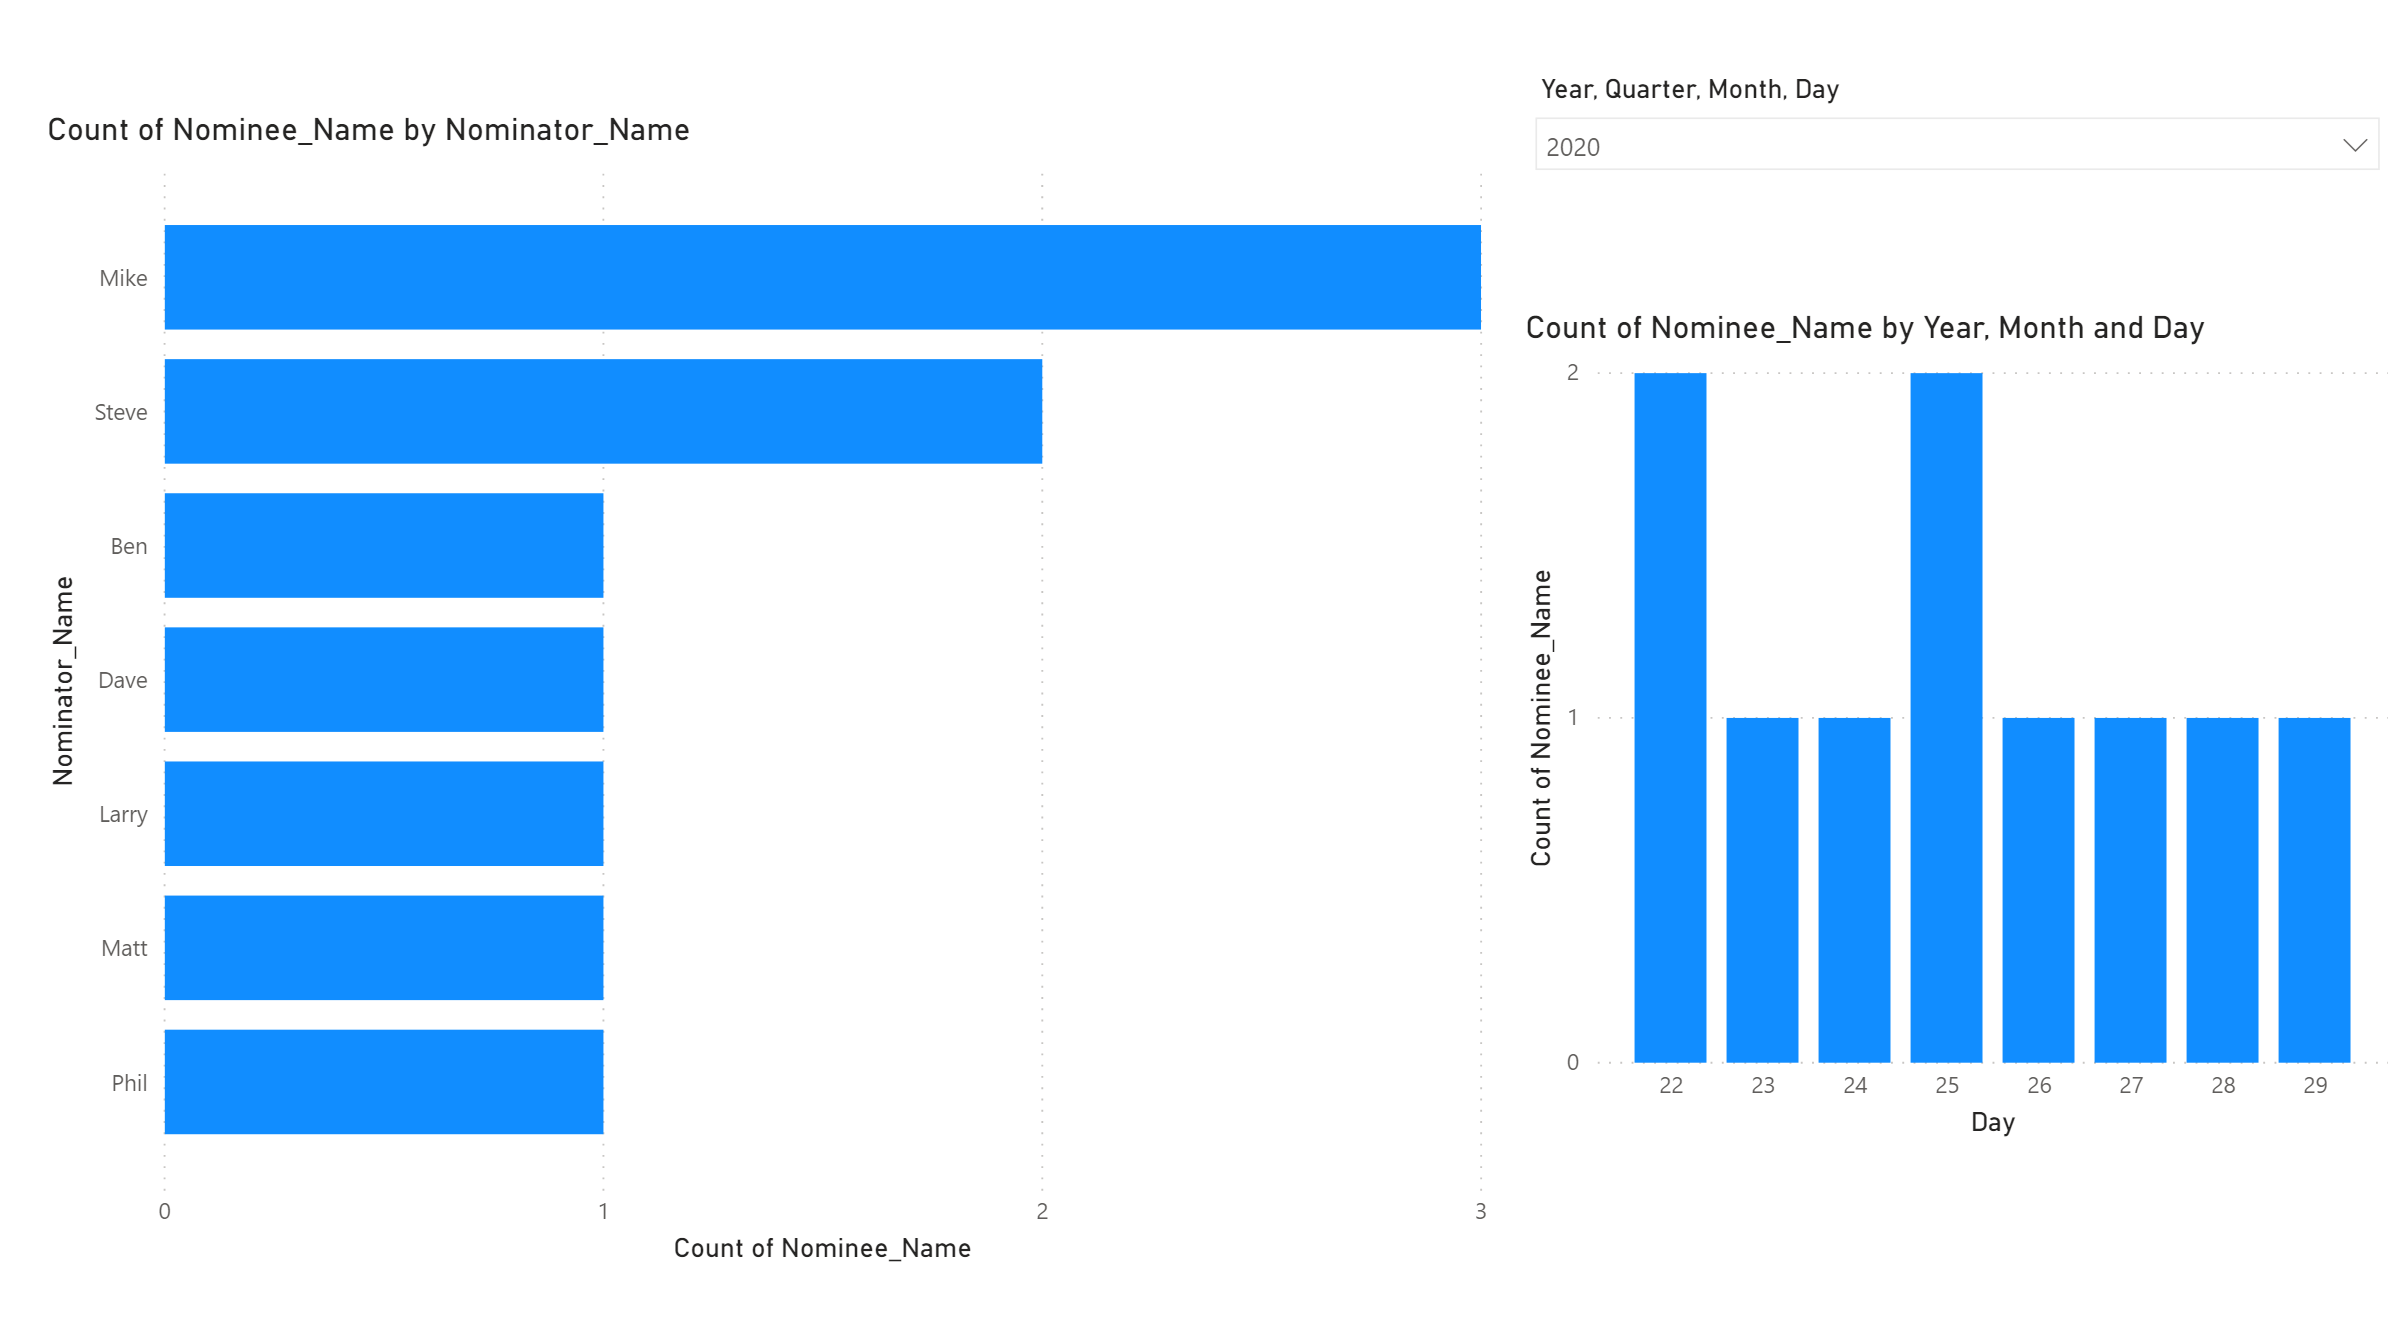
In my sample you can see that Mike and Steve were the top submitters and that there was a spike in submissions on days 22 and 25. Analysing your data by hand to find these trends can take a really long time or you might not notice them at all. A picture paints a thousand words and in the analysis time alone you can have put together a small visual with the added benefit that next time (e.g. next month) you can add to your dataset and then just click "Refresh" in Power BI desktop and the new data will be loaded in with no extra work to create a report.
This is also a good point from which you can really begin to think about the format or medium your data is stored in. I went in without a clear picture of what questions I wanted to ask from my data and found that as I began to create reports I realised what I wanted from my visuals and so knew what I needed to be capturing in the first place. That kind of refactoring in a large BI project can be incredibly time consuming and costly, so this kind of loose prototyping is excellent for teasing out the "Wouldn't it be great if we knew X" or "Are we actually capturing Y? Maybe we should?" questions before starting such a project. I find that you may think you're gathering all the data you need until you start to leverage it, there's no better time to start gathering those fields than now.
As your little report/s grows in maturity over time (5 minutes here and there adds up) always keep in mind that all time spent is an investment. My advice is to treat it like any other investment: start small and if you see profitable returns, stop and decide how you want to move forward in a sustainable way for the future.
For you moving forward may mean moving your data to an Azure SQL Database, or integrating it with an existing data source for BI via an ETL process, or even talking with your boss to instigate a larger transformation project. If you need ammunition to persuade them then you may already have several interested colleagues and your small PoC already to hand.
Power BI doesn't have to be big and scary and you can get started with some prototyping or as a data discovery tool today.
Need that extra little push/helping hand? An excellent way to kick-start your skills is to sign up for one of our free "Dashboard in a day" events run in partnership with Microsoft.