So it has been a while since the GA release of PowerBI.com and Power BI Desktop Edition (for those that remember ProClarity and Panorama Desktop tools this choice of name still makes me giggle!) and I thought it about time I put the modelling capabilities of Power BI Desktop to the test. I am a strong believer that the data model and is the MOST important part of any BI delivery. Without it we will get different answers on the same question and not have a consistent experience for end users or analysts.
Power BI purports to be a one stop shop for data blending, modelling and presentation. I have no doubt in its presentation capabilities, the dashboards look and feel great and with the GA release the ability to do basic things such as add images and customise colour schemes make it a good competitor at the front end space of your BI stack. I am also confident that by integrating Power Query connectors and transformation capabilities into the tool that basic ETL and data blending is going to be no problem. In fact I would say it is the best way available, certainly most cost effective way, to bring together cloud and on-premise data into a single place. However modelling just feels wrong in a front end tool! To put it to the test I had some basic Coeo sales data that I wanted to play around with and try and model in a way that I could deliver a monthly sales dashboard.
I found many useful things that really helped with modelling including: adding a column as a new named query, de-duping this list and then converting to a table. Features like the group by, or replacing values, ie nulls, with No Service or Unknown allow us to achieve a basic star schema! However, when I needed to generate a fact table based on a different grain I am not ashamed to say I had to go back into SQL Server and using tables and T-SQL transform, match and load the data into my new schema. This gave me the quickest and easiest way to then build my sales dashboard!
I am going to blog in more detail about some of the fun features I found along the way around modelling, dax measures, date dimension funnies and also about how we are going to build the architecture to support the Coeo Data Warehouse in the cloud utilising Azure Data Factory, SQL DWH, Power BI and Datazen! So watch this space for more! In the mean time below are the steps I used to create my basic star schema!
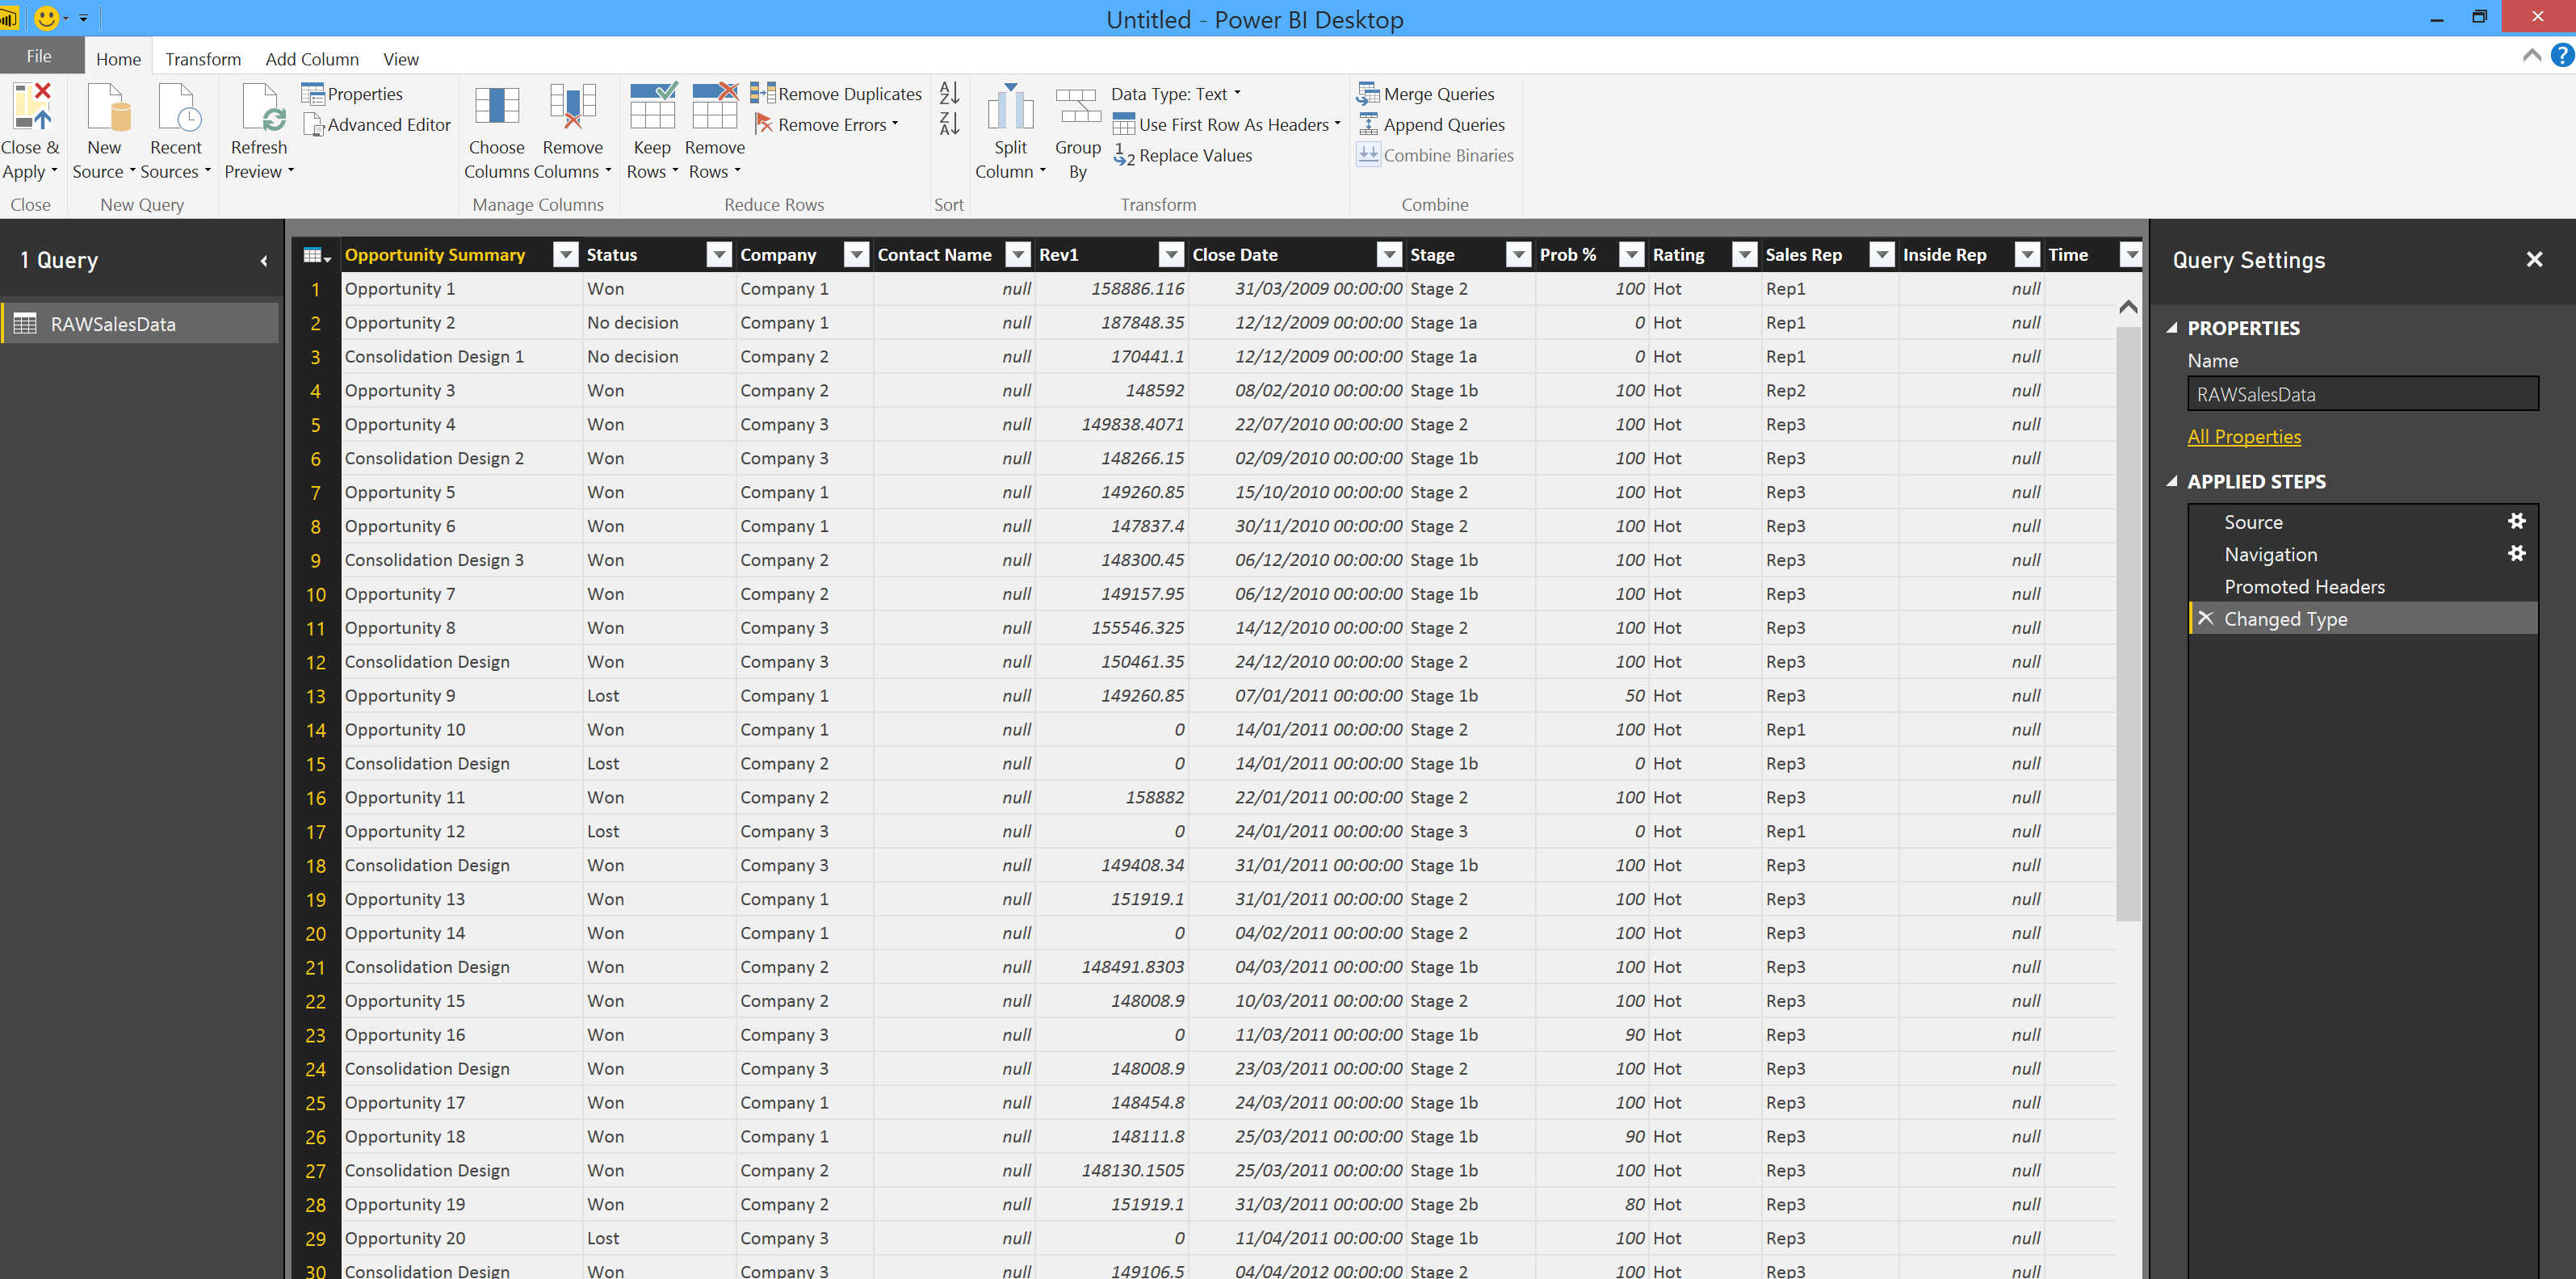
1. Starting in Power BI Desktop with a flat extract of data from our CRM system:
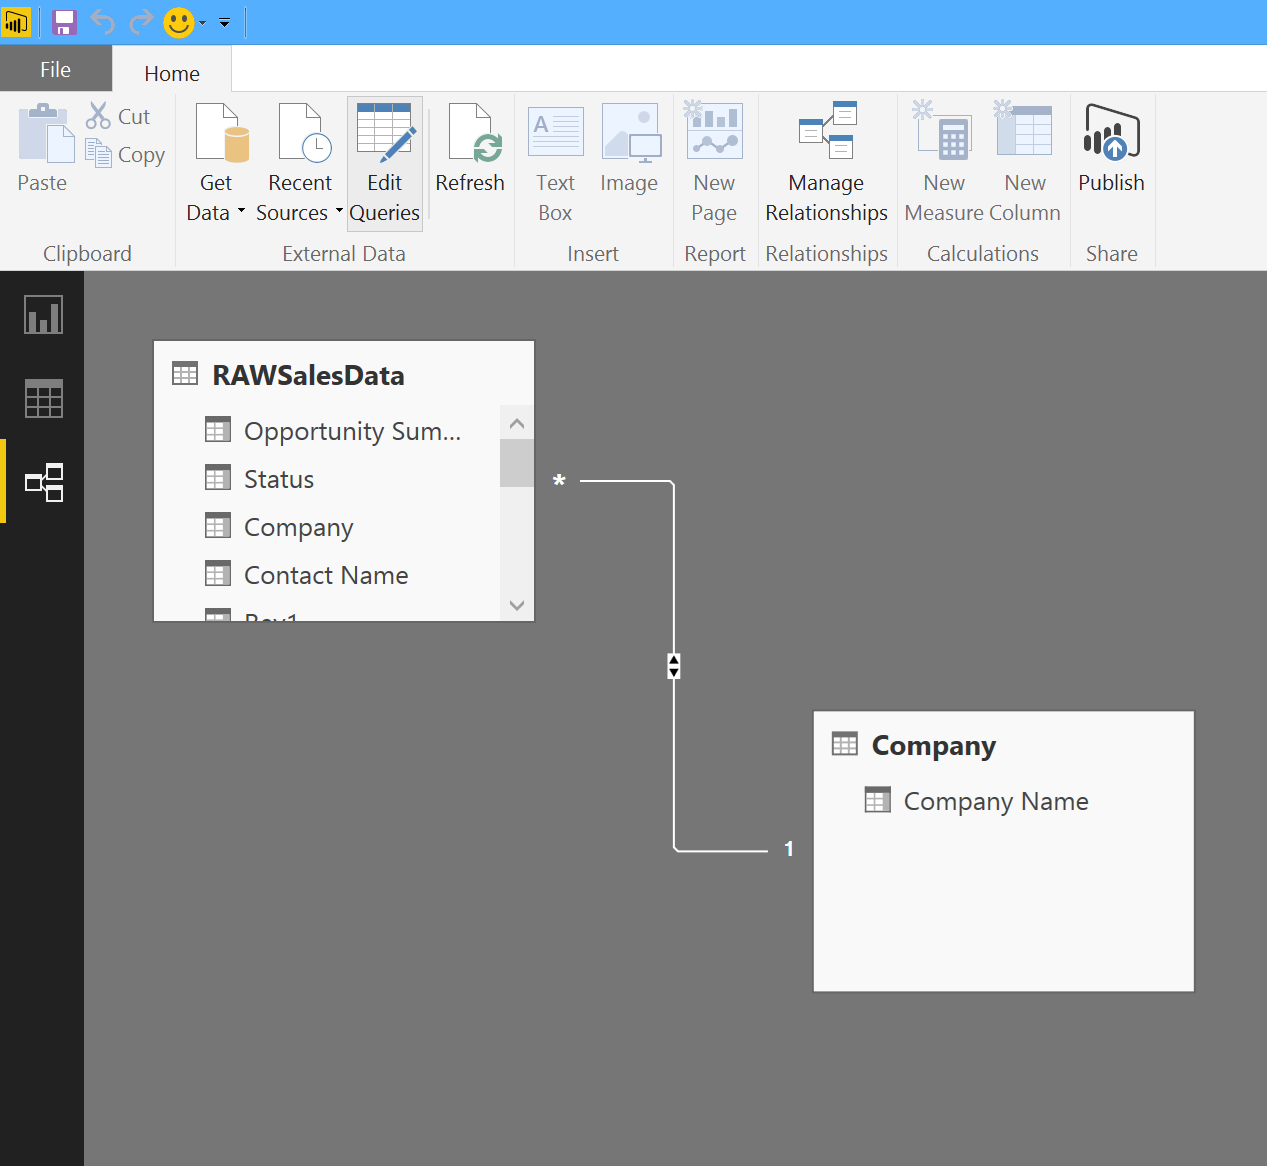
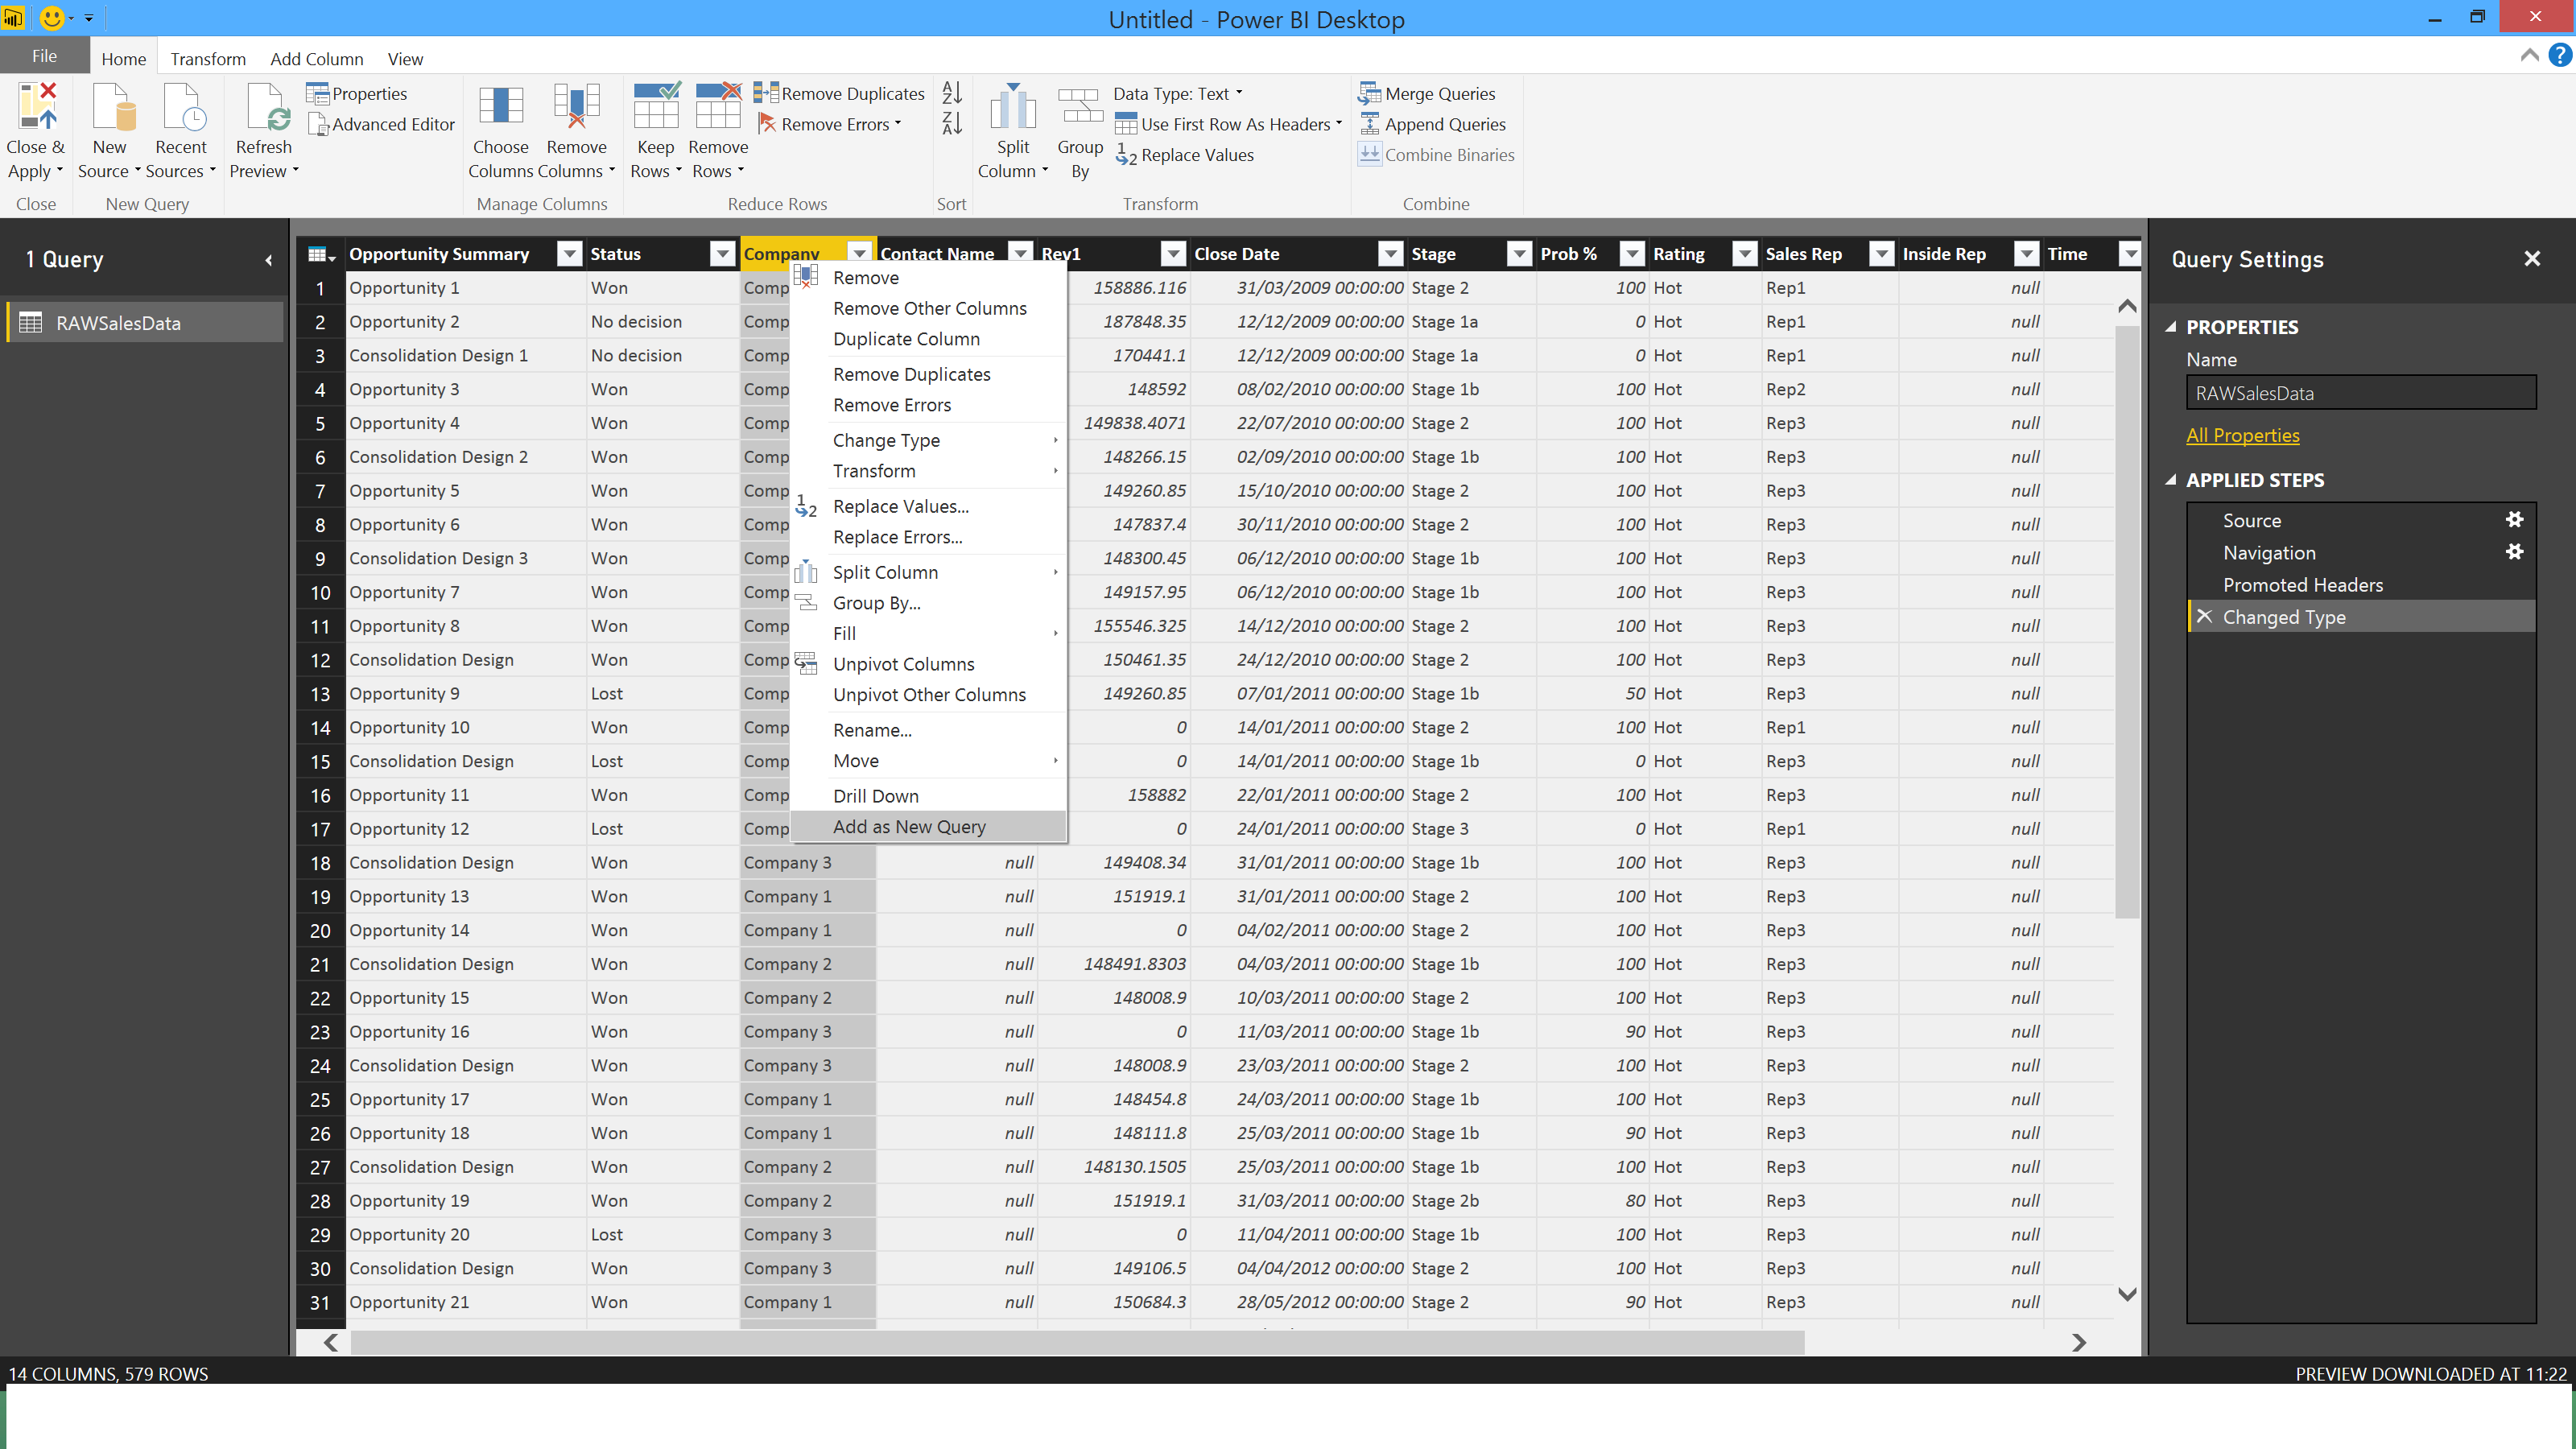
2. Now Create a dimension, e.g. Company!
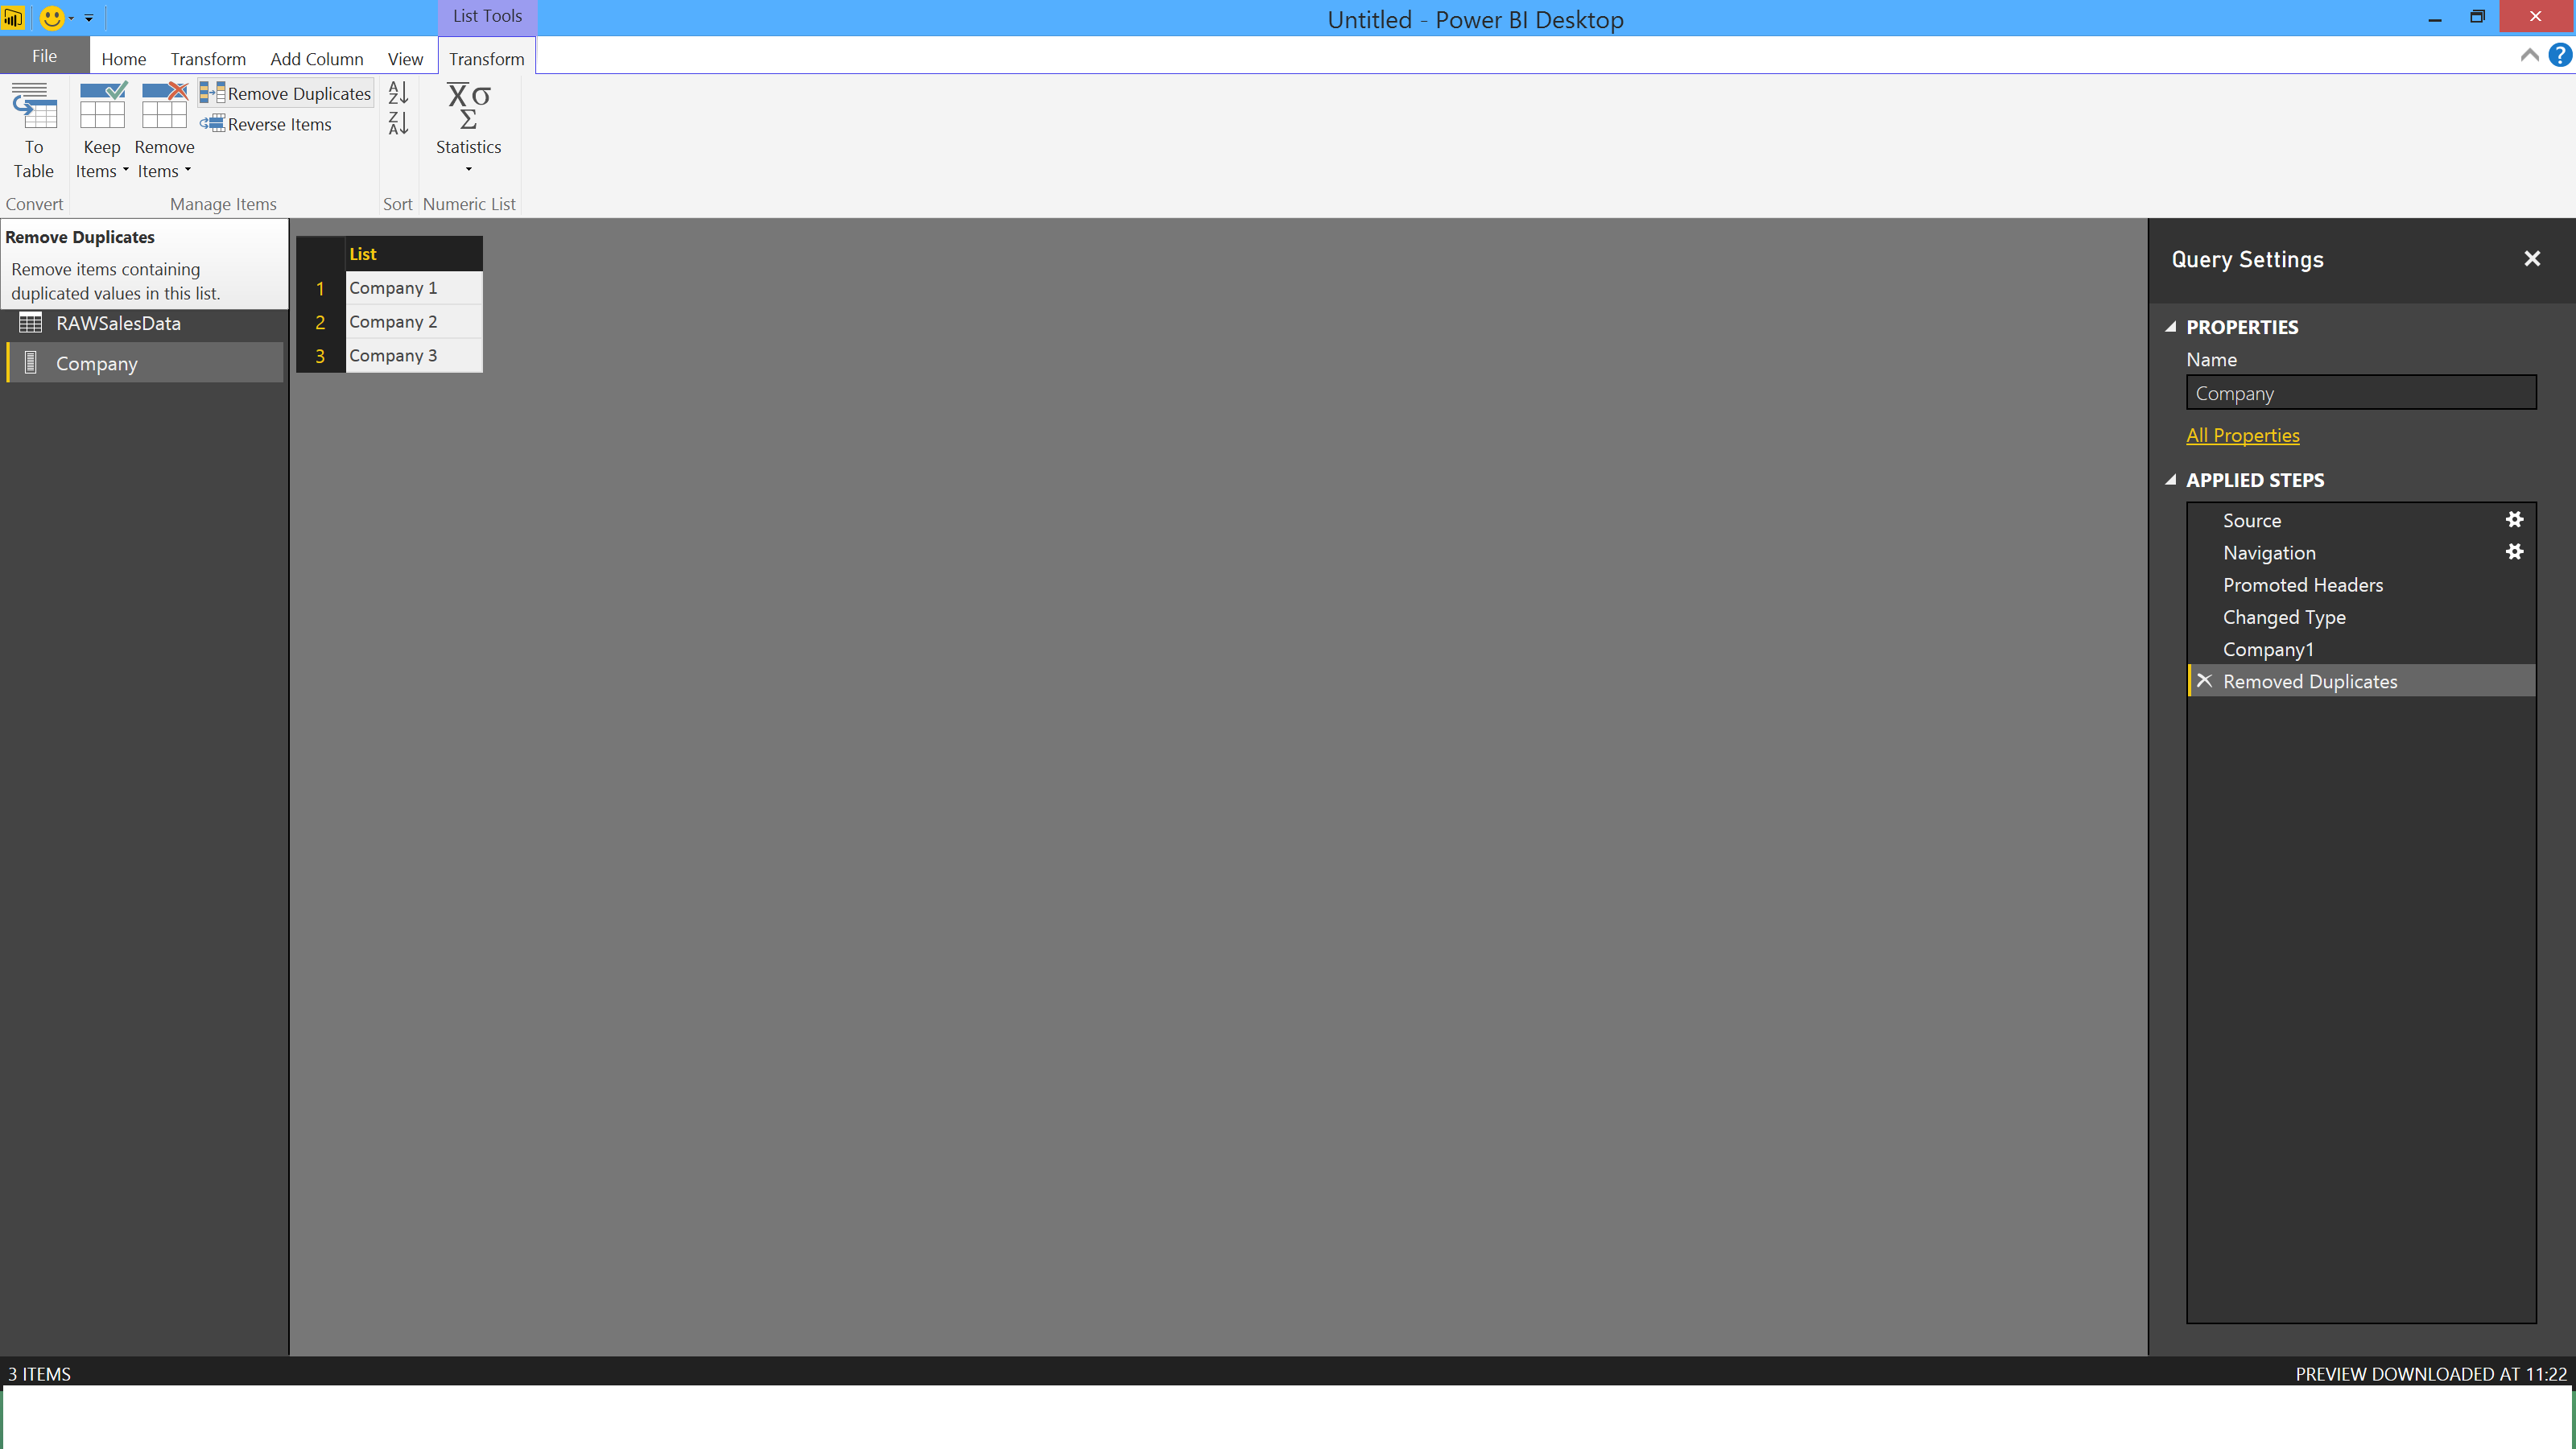
3. Remove Duplicates, as it is a dimension table and we only want unique values:
4. Now convert it to a table, we can do more with it then!
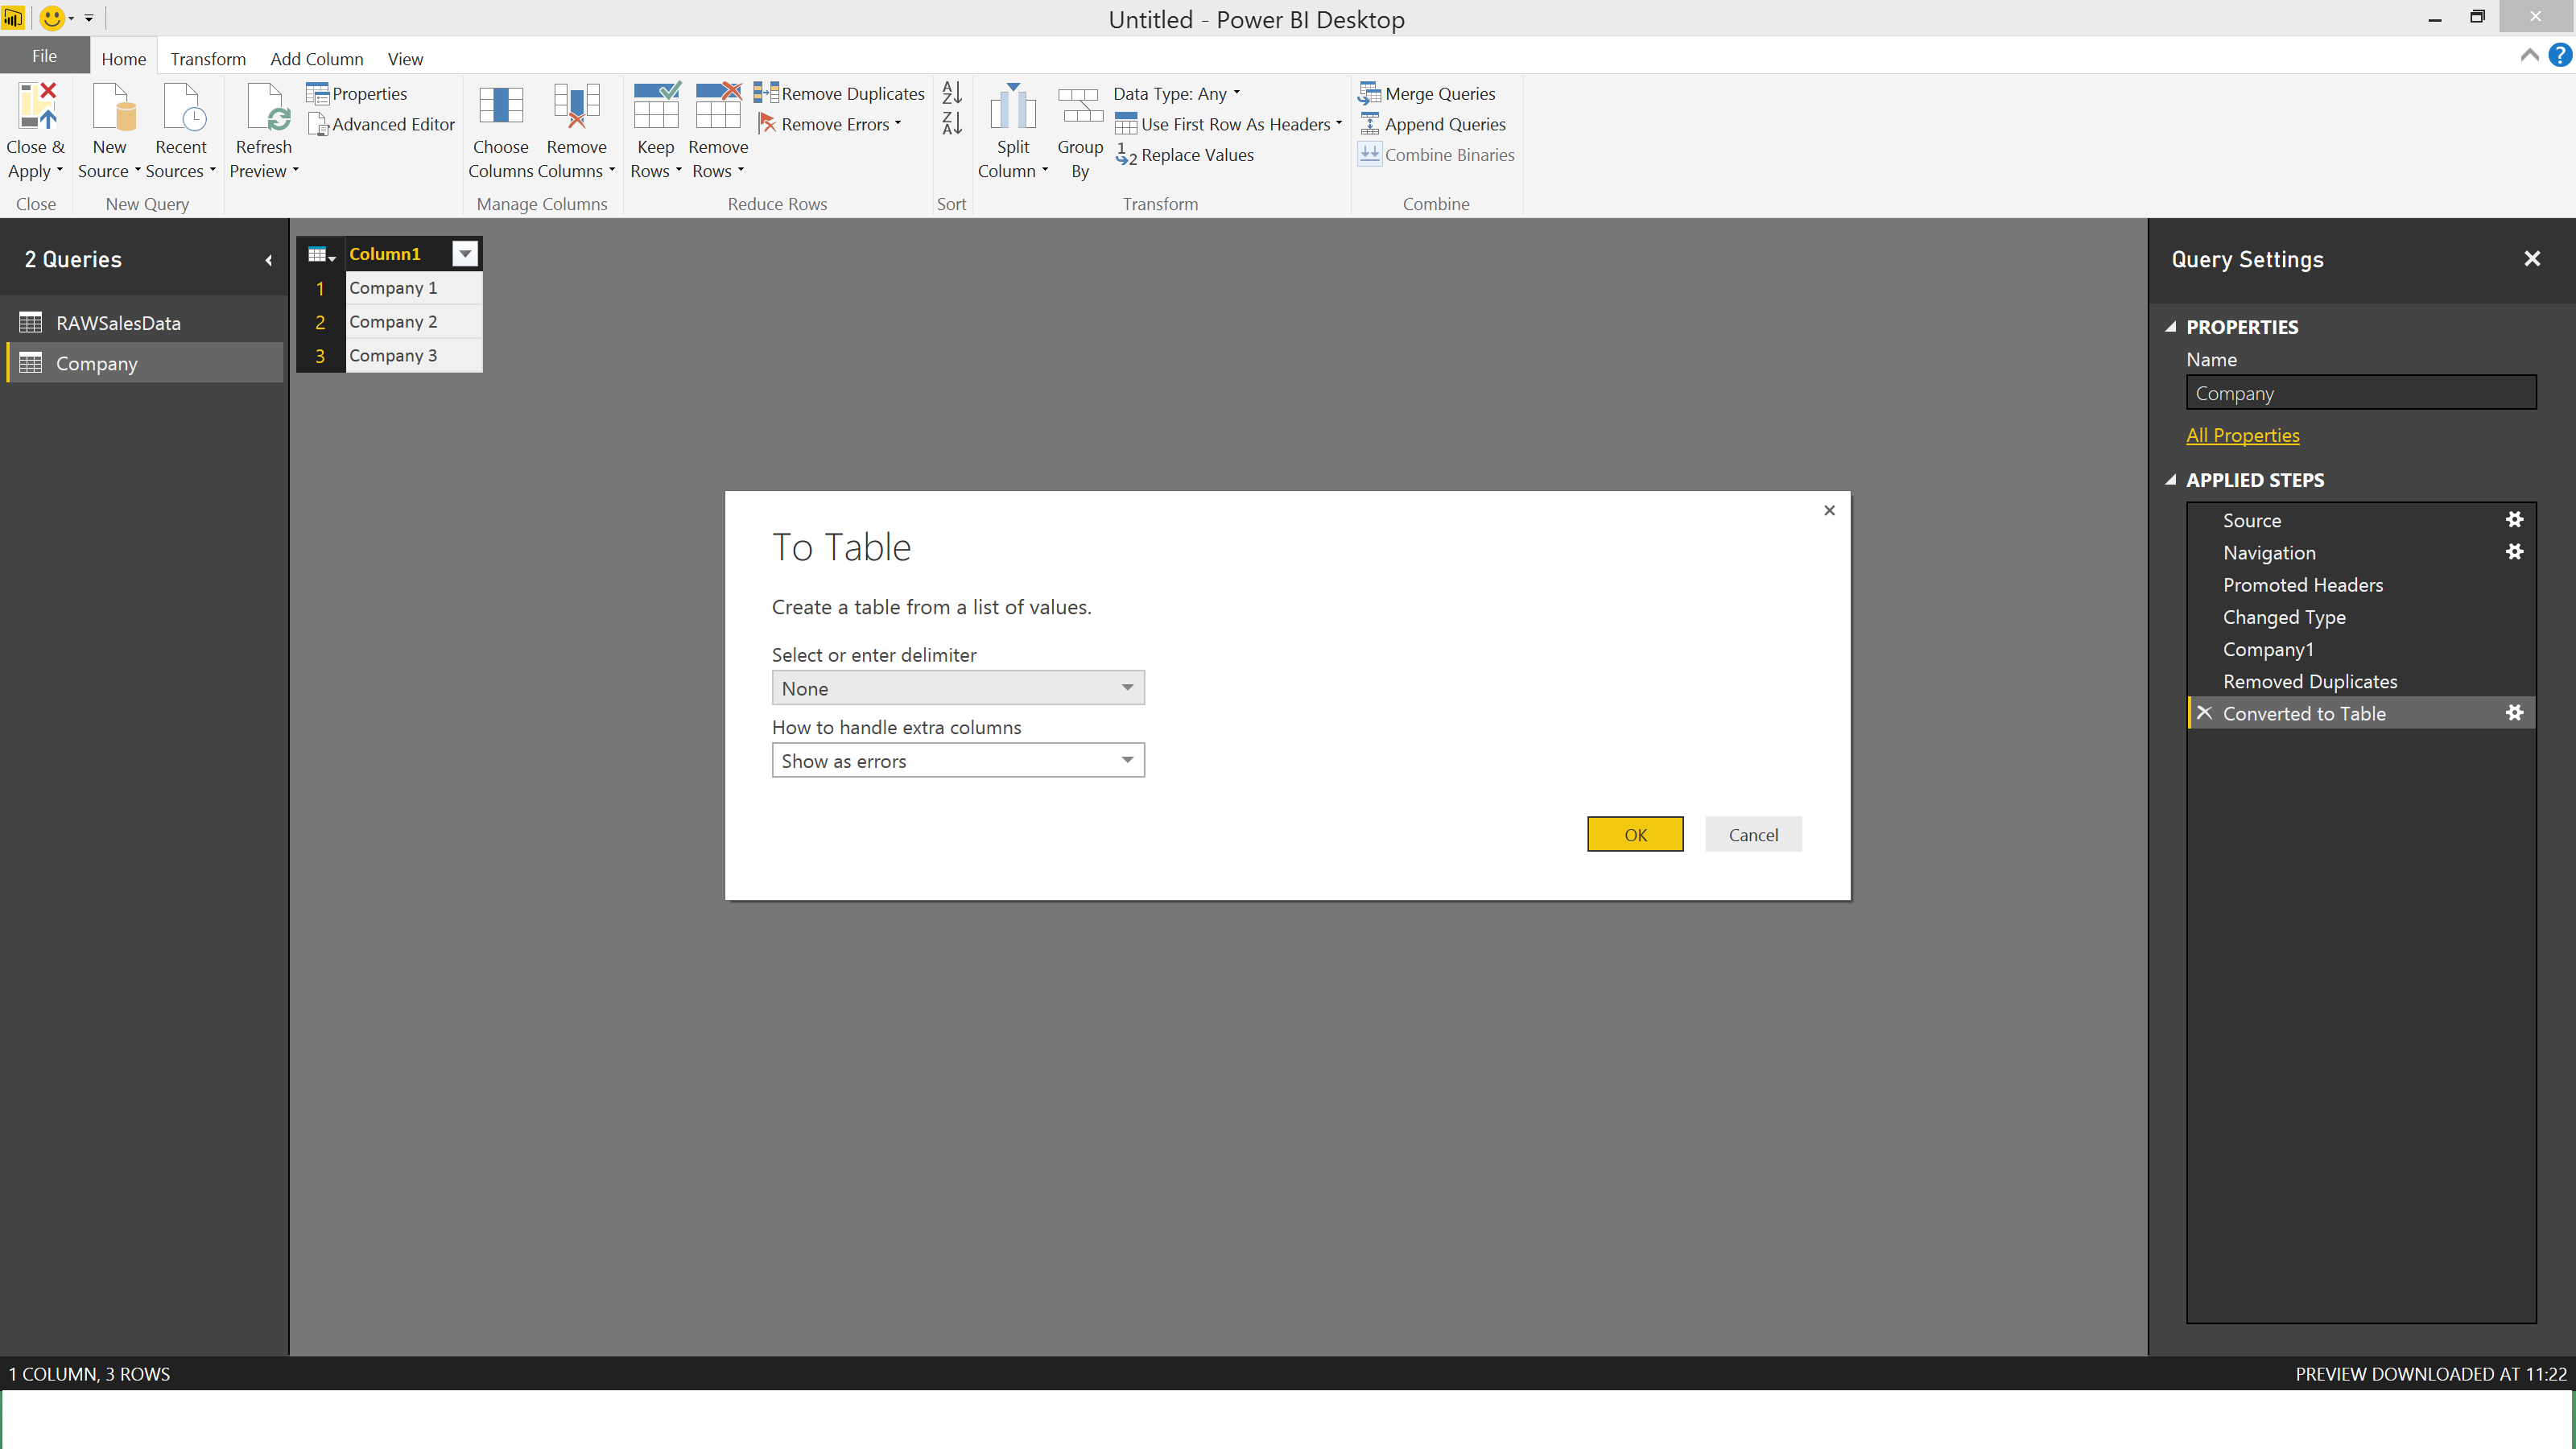
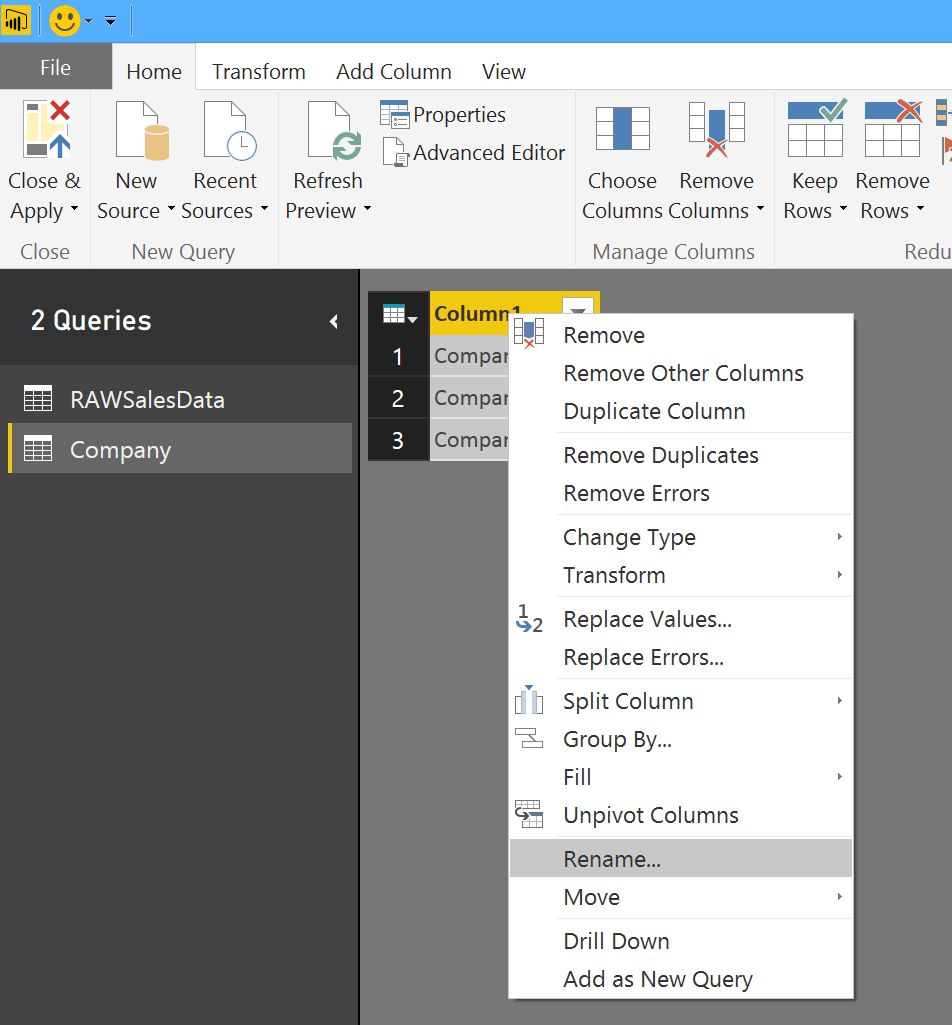
5. Such as rename the column to something meaningful!
6. Now simply close and load the queries to the model:
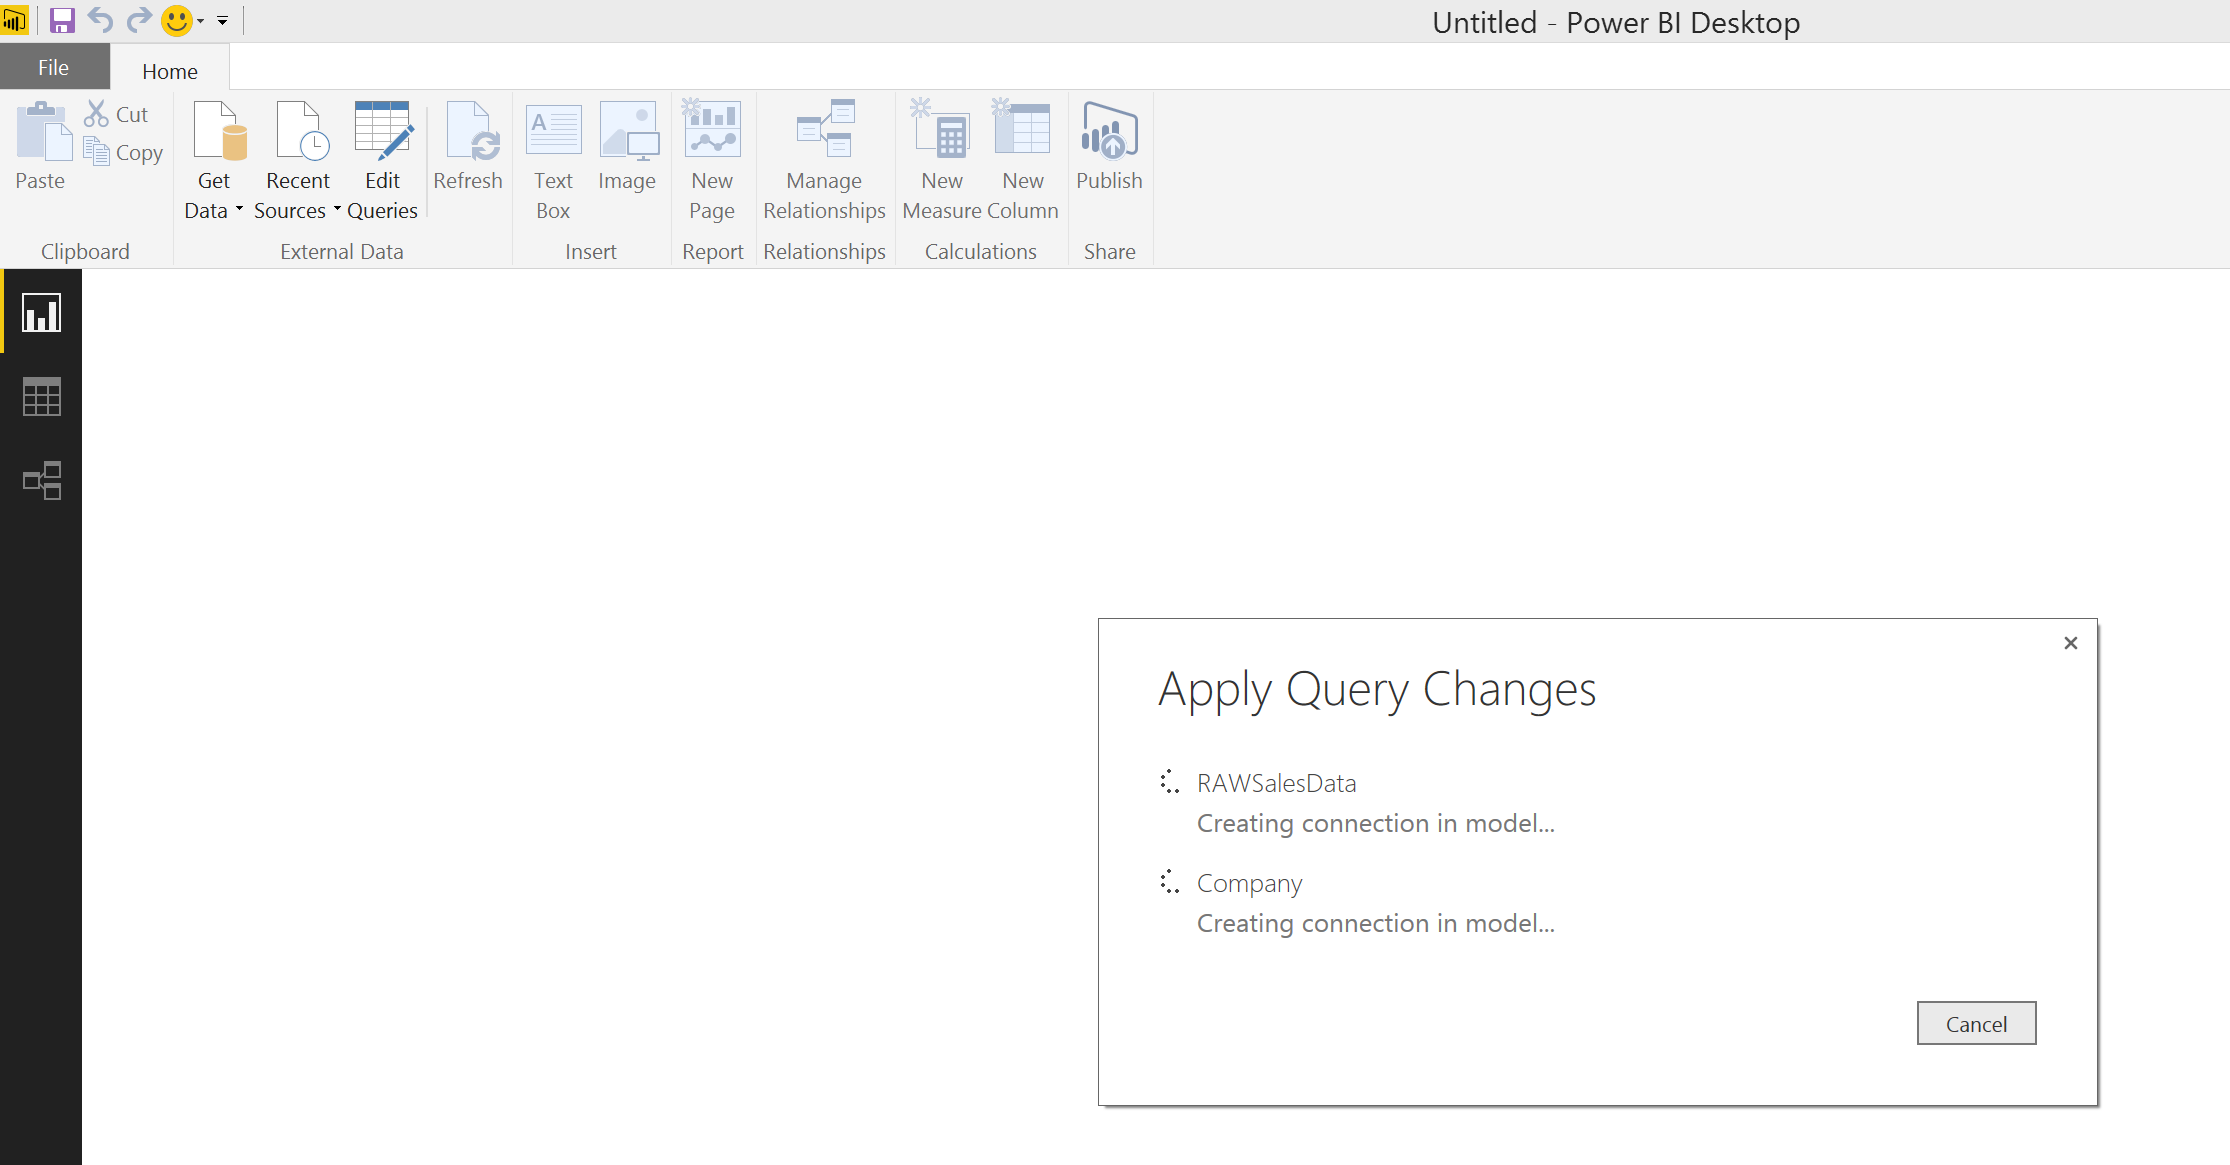
And we have a mini star schema! Simply repeat for all the dimensions you want to generate. It also works nicely for date dimensions just remember to set the correct data types, you can even add columns to form a mini date dimension!