In my previous blog post (https://blog.coeo.com/the-real-difference-between-the-select-...-into-and-insert-...-select-statements) I explored the difference between the ‘SELECT … INTO’ and ‘INSERT … SELECT’ and referenced the fn_dblog() function as a tool that can be used to retrieve information such as data changes, PFS reads, locks and so on. This post looks at the fn_dblog() function in more detail.
The fn_dblog() function, improved with the fn_full_dblog() function in SQL Server 2017, allows you to read through the active portion of the transaction log file and retrieve useful information about modification activities in your database.
A couple of things to keep in mind when using the fn_dblog() function:
- It only returns information about the active portion of the transaction log such as open transactions or the last activity
- This is an UNDOCUMENTED view and as such Microsoft have the right to change it without any notice. Therefore, I wouldn’t recommend embedding it into production code
Definition and how to query it
The fn_dblog() function must be called in the database context and requires two parameters: start and end Log Sequence Number (LSN). Leave these ‘NULL’ to retrieve the entire content of the log file or provide a start/end LSN if you are looking for a specific transaction.
fn_db_log()
fn_full_dblog()
If you want to pass a specific start/end LSN you got from a log dump, you need to convert the LSN format (3 hexadecimal numbers delimited with columns) to varchar. This is not entirely straightforward but it is very well explained in SQLSoldier's blog post, Converting LSN Format.
Columns
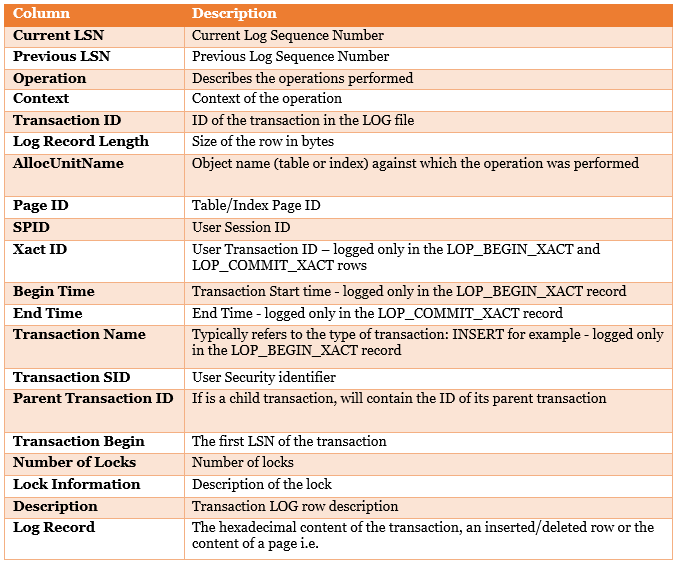
Both the fn_dblog and fn_full_dblog functions, which return the same result set, have 130 columns in them. I found the columns below to be very useful for my testing:

As mentioned in the above table, SID, XACTID and SPID are only logged at the beginning or at the end of the transaction. Each transaction has a LOP_BEGIN_XACT and LOP_COMMIT_XACT (if completed) record, which delimits the transaction in the exact same way the BEGIN and END do in a user transaction.
Therefore, filtering using one of the above columns will result in one row, if the transaction is active, or two rows if the transaction has completed. Instead, I used SID, XACT or SPID to retrieve the transaction ID and then used the transaction ID for the final result. See some examples below:
-- Run one of the following queries to get information about active transactions
-- Get Log usage for a specific transaction
-- Get Log usage for a specific SPID
-- Get Log usage for a specific user specified transaction
-- Get the active part of the LOG for a specific transaction
Operations
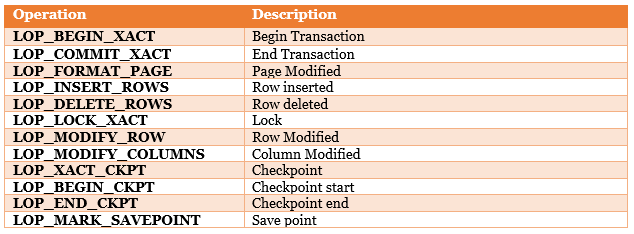
The ‘Operation’ column indicates the type of operation that has been performed and logged in the transaction log file. I found this column extremely useful to understand what happened in the transaction log file when I ran the ‘SELECT…INTO’ or ‘INSERT...SELECT’ statements. Here are some of the them:

--See all operations and their size
Usage Scenarios
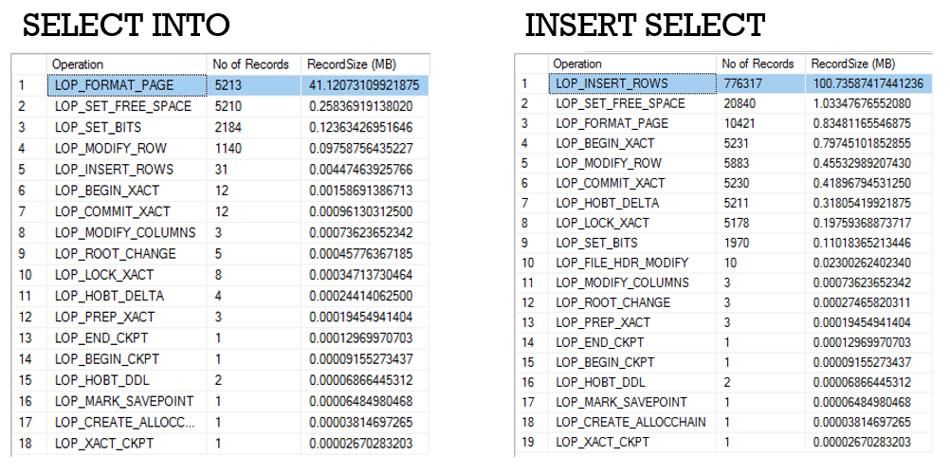
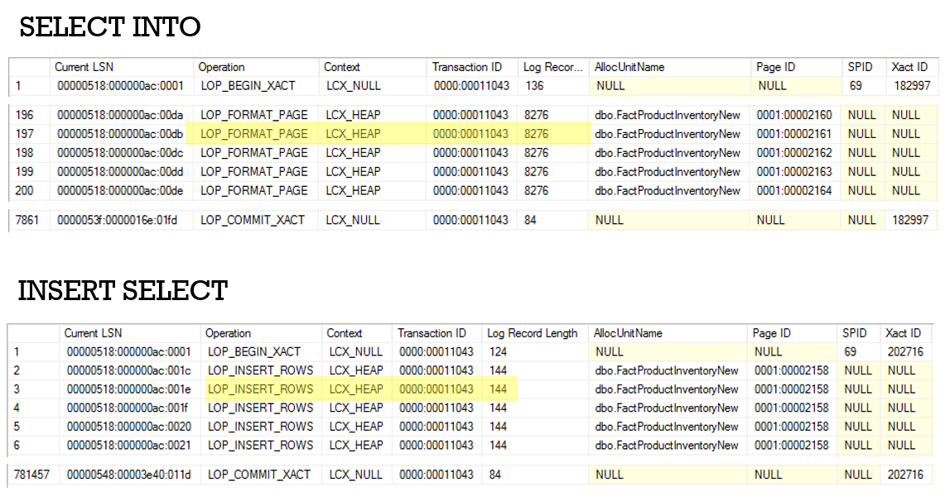
This is how the fn_dblog() function helped me identifying the real difference between the ‘SELECT … INTO’ and ‘INSERT … SELECT’ statements:


As you can see from the above screenshots, using the fn_dblog() function, I was able to determine that the ‘INSERT…SELECT’ statement is more expensive because it performs the insert in a row by row manner.
In the first screenshot you can see how the ‘LOP_INSERTED_ROWS’ operation was logged 776,317 times and was responsible for 100MB of the log usage, whilst in the screenshot below that, you can see each row inserted and logged.
On the other hand, the ‘SELECT…INTO’ simply dumped the pages into the new table; ‘LOP_FORMAT_PAGE’ was the most expensive operation (41MB) and, if you look at the size of each record in the second screenshot (Log Record Length), that is 8276 bytes (8KB), which is the size of a page.
Develop your SQL Server knowledge - learn from Coeo's experts
