
Performance analysis can be a tricky landscape at the best of times and looking at the performance of your SQL Server is no different. An initial glance at your recent high CPU usage can often spiral into a lengthy investigation, deviating far from the initial investigation.
In this blog I aim to give you a 3 step process to avoid the common pitfalls, detailing the reasoning we will use along the way.

Before jumping down the rabbit-hole, it is important to take in the high-level information and ascertain if there is an issue and where the bottleneck could be. Your go-to’s here are going to be CPU and Memory, but understanding latency and Page Life Expectancy can bring a more complete picture of server health.
You can do this by asking the following high-level questions:
- Is there a problem?
- What is the problem?
- Where is the problem?
This may seem trivial, but keeping your focus at a high-level is crucial at this point. After all, this is your initial investigation.
Think about how the question of a performance problem has come to you – is an end user experiencing slowness of an application? Are you seeing timeouts of various applications on the server? Or have you spotted a process is taking longer than you expect to?
The first two examples here definitely point back to an issue that requires investigation, while the last needs a bit more context. Is there a negative impact to something taking longer? Are you running a particularly heavy workload at the time?
Asking yourselves simple questions like these will help answer our question “Is there a problem?”.
Visualizing the data
For many, the best way to consume this information is through visual metrics. This could be through the Coeo Portal, SentryOne dashboard, or in-house monitoring software tools.
Since they can provide historical details and identify patterns and anomalies, visualizations are a great way to view and understand behaviour in order to start answering the questions we have asked ourselves. However, they may lead us to red herrings if we do not understand their relationships.
Below are some key thoughts to consider when analysing visual metrics.
Is it Business As Usual (BAU) behaviour?
- It is important to have a picture of server behaviour over an extended period of time.
- How does activity look generally over the week?
- Is it consistent with the same time last week?
- It is worth noting that behaviour can be both BAU and poorly performing. This is just an observation on whether or not activity has changed.
This is how we can begin to validate the questions “What is the problem?” and “Where is the problem?”.
What does the graph show?
- Is it a spike? Think of persistence when considering performance issues.
- Does a jump in CPU correspond to a change in load? This could be running start of month reports.
- Being aware of changes like this is vital to your understanding of why you might experience performance issues.
- If not, then you can successfully rule this out and look to more in-depth causes - such as a bad query plan.
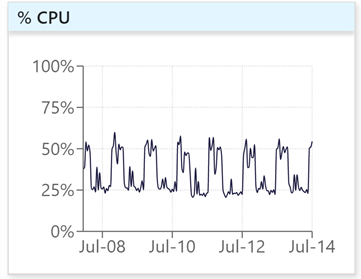
| BAU CPU, showing daily patterns of activity |
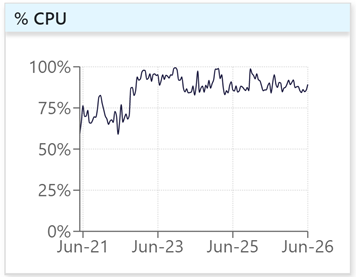
| CPU showing a sustained change in behaviour |
Quantitative guidance
Fortunately, there are some numerical measures to consider when evaluating performance on a server, giving you the ability to compare a couple of metrics in your server to the expected value you might see on a healthy one.
Page life expectancy (PLE):
PLE is the amount of time a page is stored in the SQL Server buffer pool (the memory cache), before being pushed out to accommodate a different page. When performing a transaction, SQL Server looks for the data in memory as a first point of call and if not present will go to disk directly to retrieve the data.
If low PLE is observed, this indicates that the server would benefit from extra memory.
A rough rule-of-thumb based on Microsoft recommendations is as follows:
If poor PLE is observed this could be the result of high ad-hoc query activity on a server or insufficient memory. However, exceptionally low read latency can mitigate this impact.
Read/write latency thresholds:
While these recommendations are valid, they must be taken with a pinch of salt. As we’ll describe in more detail shortly, poor PLE might be observed, but if there is no performance issue occurring then it is not a problem. Other server properties can act as compensation and keep everything running smoothly.
Tying together metrics to understand performance
It is important to remember that each performance metric is not an isolated component. They are all pieces of the server jigsaw you have in front of you.
Consider, for example, a sever where you are known to have poor RAM availability for your needs. This in turn affects your PLE, which means that the retention of a page within memory is low, due to high demand for the memory space it occupies.
This forces you to read from disk a lot and the performance now relies on your read latency. If you have fast latency (on the necessary disks), you can compensate the memory limitations you are faced with. If not, you may have found a potential performance bottleneck, resulting in large waits and query timeouts.
This is an example of how PLE/memory and latency may account for each other's short comings.
As this example illustrates, looking at these metrics on an individual basis only gives you one piece of a complex puzzle.
Everything is interrelated and without understanding how the cogs in the machine interact with each other it is hard to confirm if the server is excelling, over-resourced, or fighting a losing battle.
Final thoughts
This blog is intended to give you a high-level understanding of SQL Server performance from metrics you might commonly see. With an understanding of these elements and how they interact, you can then decide if further investigation is required, and decipher where to look next.
Throughout the process, you should keep in mind the context of your investigation, as illustrated through the 3 questions we have asked ourselves. With a clear vision of what poor performance is you can effectively decide how to manage the information at hand.