
We have spent much of the past year working with clients to design, implement and support an increasing number of analytics solutions to help them get the most out of their data and progress their data maturity.
As part of this, we're seeing lots of clients wanting to migrate on-premise architectures to Azure SQL Databases, and use cloud-based analytics solutions in Azure like Databricks and Synapse to process, transform and capture insights from the raw data and ultimately deliver value from it.
While this is something we've been seeing increased demand in; is the shift to the cloud representative of the greater data community?
Anyone who has Googled IT-related questions in the last decade will recognise Stack Overflow as one of the top sites for programmers asking and answering questions, from basic to advanced edge-cases. To re-word this more appropriately for our context, it contains data which captures what the data community has been asking over several years, with many questions having several thousand hits. It represents a great deal of knowledge sharing that relates to the goals our clients share and the technologies Coeo helps to implement.
We can use this to see if our recommendations are on trend with the questions the data community are asking.
Using (and possibly abusing) Stack Overflow’s API, we can pull data directly related to various Azure technologies and evaluate how interest in them has changed over time, gaining some insight into what people are asking about the products.
Explore the data for yourself in my GitHub Repository.
We've looked at the following products, searching Stack Overflow questions tagged (labelled) with each respective product:
- Azure SQL Database (Stack Overflow tag: azure-sql-database)
- Azure Data Factory (Stack Overflow tag: azure-data-factory)
- Azure Synapse (Stack Overflow tag: azure-synapse)
- Databricks (Stack Overflow tag: databricks)
- Power BI (Stack Overflow tag: powerbi)
High Level comparison
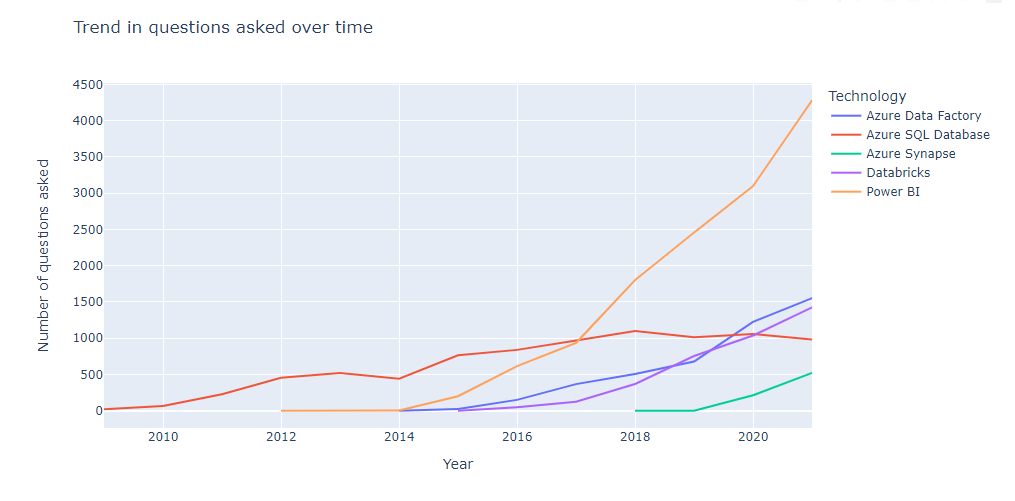
Power BI sees the greatest number of questions year-on-year, with the volume of questions increasing at a growing rate. This isn't surprising considering its versatility, and the widespread desire for data visualisation tools to enable valuable insights through descriptive analytics.
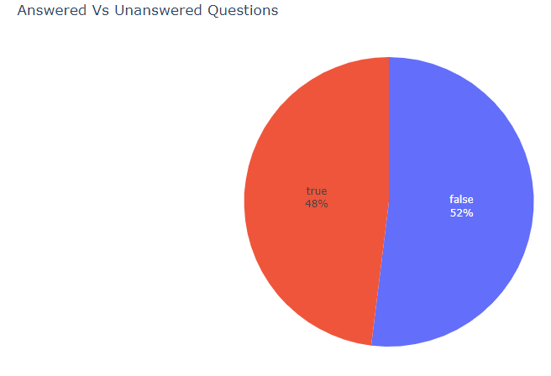
It is also interesting to look at the split of answered vs unanswered questions, as this can provide information such as:
- Bugs
- Documentation availability
- Ease of use
There are many factors that might hinder a question being answered, such as poor grammar or ambiguity, but that is analysis for another day.
Specific Highlights
Azure Synapse
Given it is still a relatively new product, there are various questions around Synapse which are yet to be answered – with more questions unanswered than answered at present.
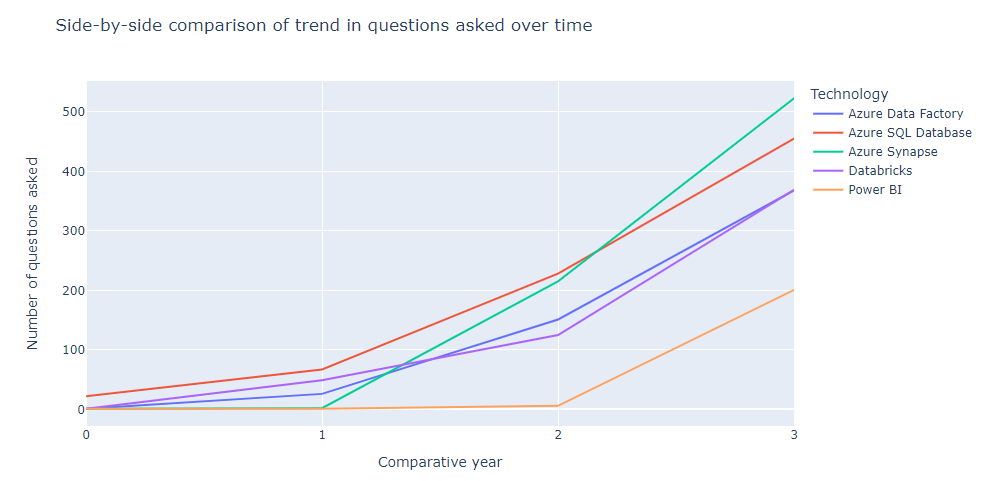
Plotting the questions count for each technology on a side-by-side comparison, we can see Synapse has experienced a very quick adoption, and is the most-quizzed technology on Stack Overflow in the first 3 years (of those looked at in this post).
Databricks
Given that Databricks is independent of Microsoft, I was curious to see the breakdown of tags specifically assigned the 'azure-databricks' tag. From the data collected we can see approximately 1 in 4 have this tag, showing that the Azure implementation is very popular.
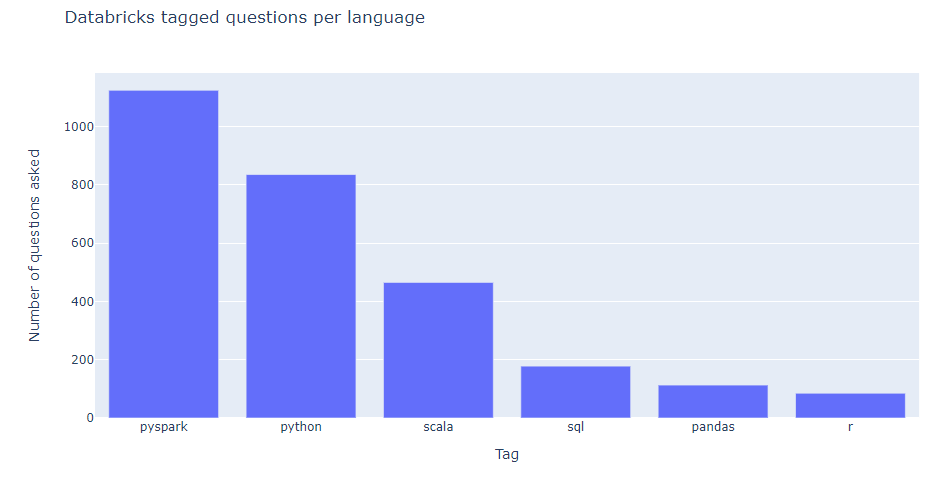
Looking at the other question tags for Databricks, we can see the languages/APIs people are using in Databricks, with far more questions related to PySpark and Python than Scala, SQL or R.
Power BI
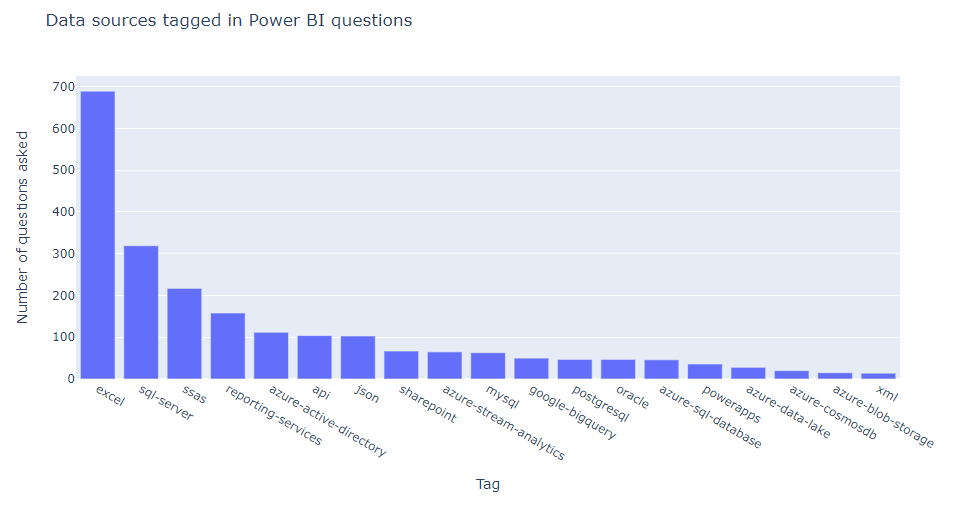
Power BI’s compatibility with a wide (and expanding) range of data sources means it works well as a standalone product, or when integrated in a full reporting system.
Of the data sources tagged in Power BI questions, Excel is by far the most frequently tagged, currently overshadowing all database technologies (SQL Server, Azure SQL DB, Oracle, mysql, etc) combined.
Conclusion
As we've seen from the data collected in this blog, the world is moving to cloud-based solutions and companies worldwide are learning how to leverage Azure technologies to get the most out of their data and accelerate their business intelligence.
As demand and education grows around data, we might see a shift in interest toward Azure Synapse and Databricks as Data Lakes become a more well-understood architecture. We may also see the data sources better suited for “real-time” reporting, like Azure Stream Analytics, in Power BI become more popular.
If you are interested in progressing your data maturity and want to understand how you can transition to use any of the technologies mentioned in this blog, get in touch with Coeo for more information and find out how we can help drive your data strategy forward.