
Stats and cooking
Statistics, what are they? You hear about them a lot and how important they are, but do you know what really happens under the covers?
Statistics are used to aid the Query Optimizer for the creation of query plans that improve performance of the queries you are running. Think of it like a knife being used to cut ingredients when cooking, where the knife is statistics, the knife sharpener is a statistics update, and the meat being the query that is being executed by the query optimizer (chef). The sharper the knife, the faster and more efficient cutting is, much like if you keep your statistics updated, the faster your queries will run.
Why do chefs sharpen their knives regularly in the kitchen? So, they can cut faster and be efficient with their time. Imagine having multiple pots going simultaneously and you must get your timing right otherwise parts of your final dish can be ruined by being overcooked or raw. If you have not sharpened your knife and you’re spending a longer time trying to cut your vegetables, chances are you’re going to be eating later than planned as other parts of your dish must wait until you’re done with the veg.
It is exactly the same in SQL Server. With out-of-date statistics, this can mislead the optimizer to choose more costly operators (more effort from the chef) by using an index scan over an index seek, and can cause higher usage of CPU, memory, I/O, and can also lead to blocking (longer cooking times) and deadlocks.
How do I view SQL Server Statistics
We can view Stats in 2 ways, whether you’re a GUI lover or a T-SQL lover I have a present for you both down below:
GUI view of Stats
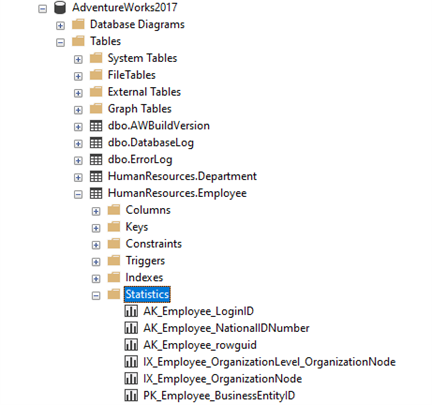
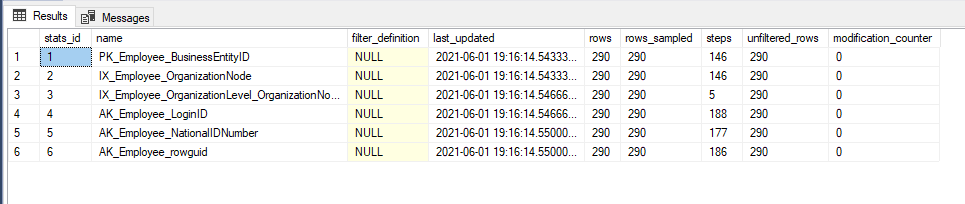
To view through the GUI, you must connect to the SQL Server instance via SSMS and then expand on the table within the database of your choice to see all available statistics. Down below I’ve chosen my [AdventureWorks2017] database and viewing the statistics of the table [HumanResources].[Employee]:
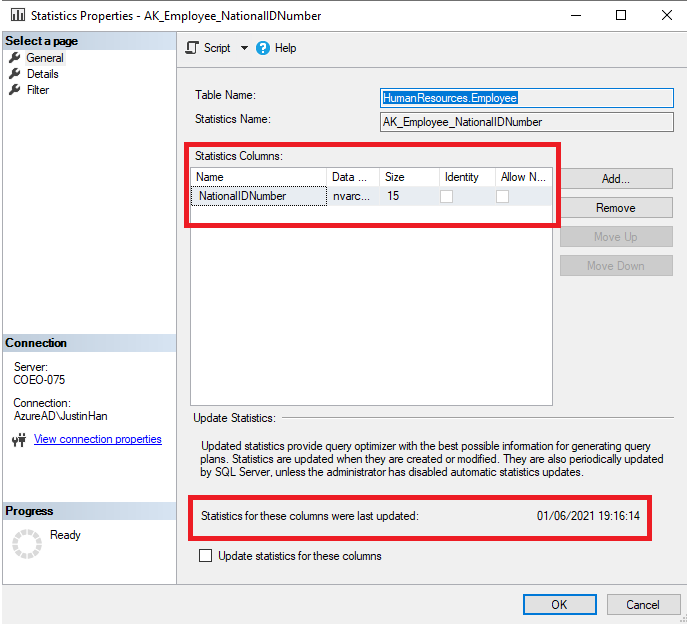
From here, you can right click on one of the statistics, then click on properties, which would show the statistics columns and the last update performed on this column:
Clicking on the ‘Details’ page on the left hand-side will show us further information about the statistic as shown below:
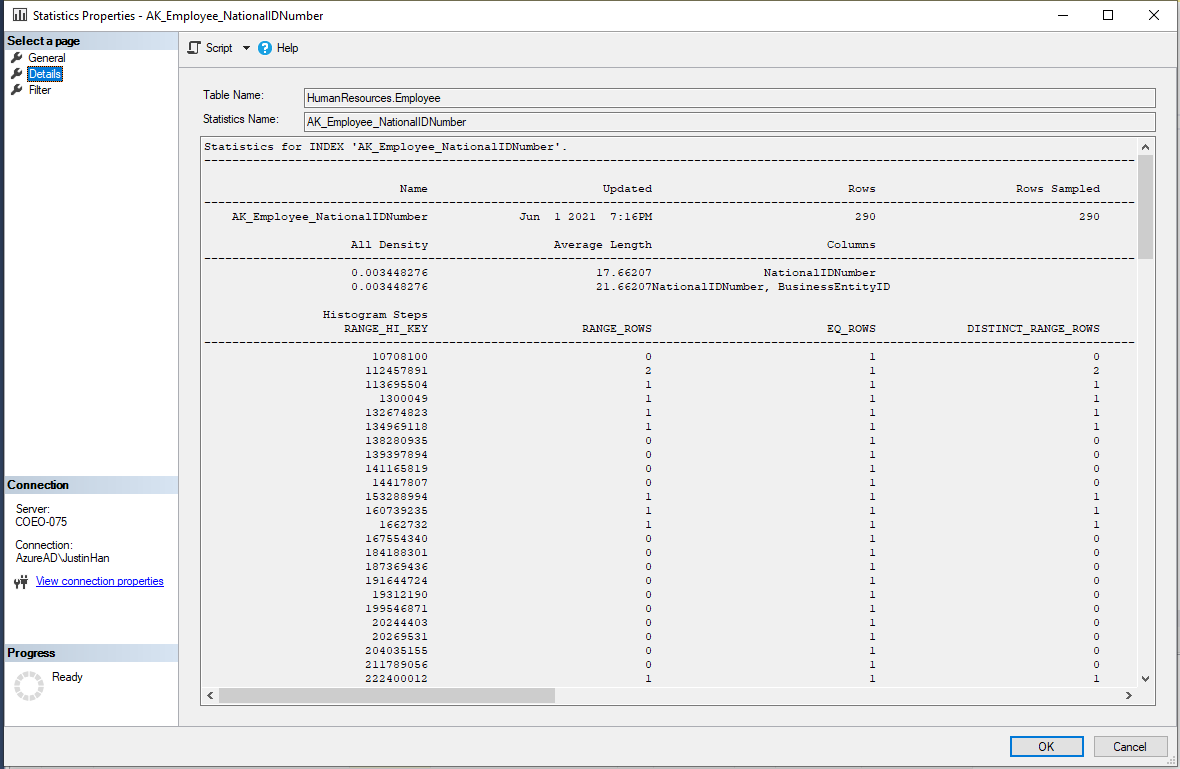
What is to note here is that by default, SQL Server will not read every row but will sample a portion of the total rows depending on how big your tables are, and then builds the statistics.
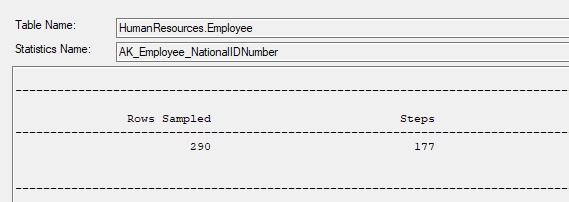
What is also to note from the columns we see here is that the number of ‘steps’ shown, SQL server will summarize the statistic into no more than 200 steps. This is based around the steps required via a histogram calculated by the query optimize using a maximum difference algorithm. If we scroll across for this statistic, we can see that the number of steps is 177 as shown below:
T-SQL view of statistics
To view Stats via T-SQL we would use the DMV sys.db_stats_properties as shown below:
SELECT sp.stats_id, name, filter_definition, last_updated, rows, rows_sampled, steps, unfiltered_rows, modification_counter
FROM sys.stats AS stat
CROSS APPLY sys.dm_db_stats_properties(stat.object_id, stat.stats_id) AS sp
WHERE stat.object_id = object_id('HumanResources.Employee);
- Stats_id = unique identifier for the Stat
- Name = Name of the Stat
- Last_updated = Date and Time of the last Stats update
- Rows = Number of rows at the time of the Stats update
- Rows_Sampled = Total number of sampled rows for the Stat
- Modification counter = This will tell us the total number of modifications for the statistic column (from which the histogram is built on) since its last Statistics update.
You can also view the histogram for statistics. This is a representation of data points grouped into specified ranges. This is shown below:
DBCC SHOW_STATISTICS ("Person.Address", AK_Address_rowguid) WITH HISTOGRAM;
GO
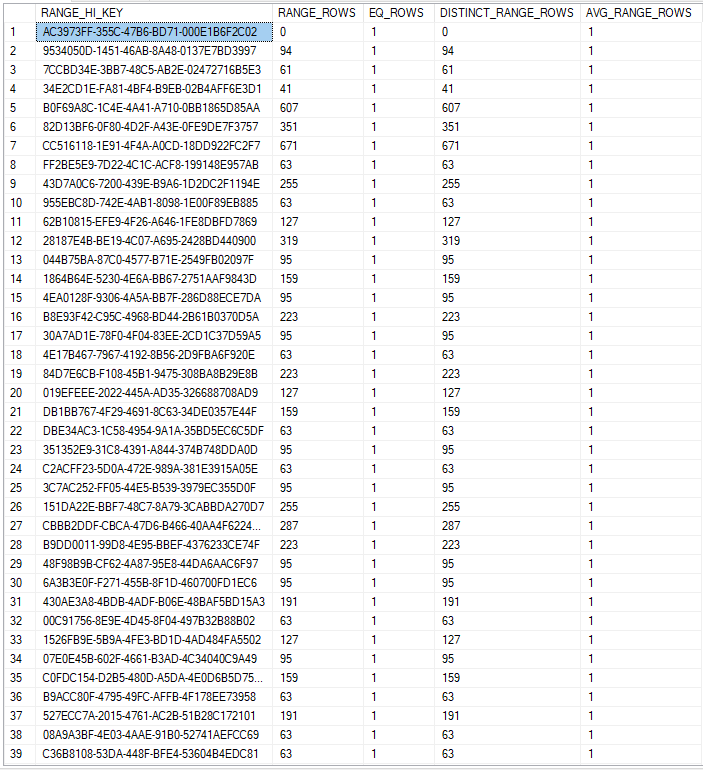
Shown above from left to right for the columns:
RANGE_HI_KEY - upper bound column (key) value for a histogram step
RANGE_ROWS - Estimated number of rows whose column value falls within a histogram step, excluding the upper bound
EQ_ROWS - Estimated number of rows whose column value = the upper bound of the histogram step
DISTINCT_RANGE_ROWS - estimated number of rows with a distinct column value within a histogram step, excluding the upper bound.
AVG_RANGE_ROWS - Average number of rows with duplicate column values within a histogram step, excluding the upper bound.
But where do they come from/how are they created?
Statistics are created via 2 ways. 1 being automatically when a new index is created, and the other is when the ‘AUTO_CREATE_STATISTICS’ setting is ON, which means that SQL Server will automatically create statistics for non-indexed columns that queries will utilize.
This can be enabled with the following command:
ALTER DATABASE DBname
SET AUTO_CREATE_STATISTICS ON;
So how do I update statistics?
Like cooking, there are many methods to make a meal, much like in SQL Server there are many ways to update statistics. Each DBA has their own preferred way of updating stats, as well as every chef has their own preferred method of cooking.
In this section we will be discussing a couple of ways to update stats.
T-SQL
This is simple, much simpler than you think considering the performance gains it can achieve.
In this example we’ll be updating all statistics for the table “HumanResources.Employee”:
UPDATE STATISTICS HumanResources.Employee;
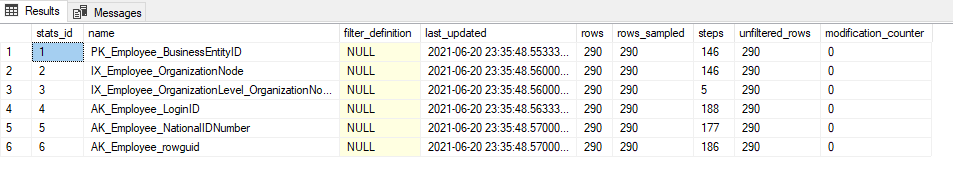
As we can see from the above, Statistics has been updated to a more recent date.
Update all statistics.
Rather than updating just 1 table in a database, we can update all statistics within a database. This is done through the following command:
EXEC sp_updatestats;
This method may not be efficient for larger databases however due to it taking longer executions and resources to complete. Much like trying to chop up a full cow with a knife rather than a targeted cut.
Another way to update all statistics within a table is when an index rebuild is complete. During an index rebuild, SQL Server will also as part of this automatically update all relative statistics with a FULL SCAN.
Automating the process
Rather than logging on to the server and remembering to perform an update statistics we can set up a SQL Server Agent job to do this work for us on a regular schedule. It’s simple, just create a new job and add the UPDATE STATISTICS step you want for the tables you need, and then create a schedule to run this during quieter times for your server. It is ideal to run any maintenance tasks on your SQL Server instance during off-peak times when there is less usage on the databases and the server in general.
Auto-Update Statistics
Synchronous
Even without our intervention though, by default SQL Server will automatically update stats for us.
We can also enable ‘AUTO_UPDATE_STATISTICS’ where SQL Server will automatically update stats for us synchronously without a regular SQL Server Agent job enabled. By default, SQL Server has this enabled for all databases.
How this works is that with each INSERT/UPDATE/DELETE against a table, this will be counted within SQL Server internally.
Table 1: From MSDN Statistics https://docs.microsoft.com/en-us/sql/relational-databases/statistics/statistics?view=sql-server-ver15
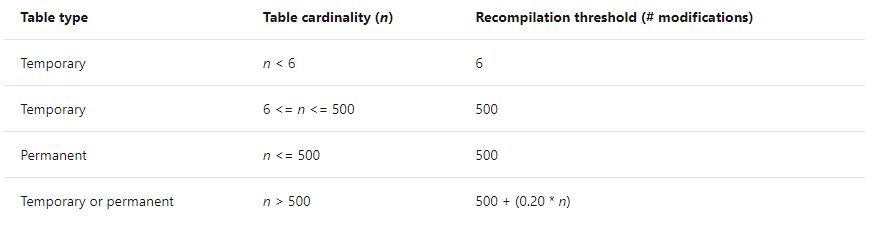
Above is for SQL Server 2014 and below. If your table is under 500 rows, then after 500 modifications (INSERT, UPDATE, DELETE) SQL Server will perform an automatic UPDATE STATISTICS for you against that table. However, if your table is larger than 500 rows, then this number becomes 500 + 20% of the number of rows your table has – e.g. if your table has 10,000 rows, after 2500 (500+ (0.2 * 10,000)) modifications, the table will be have an UPDATE STATISTICS performed against it.
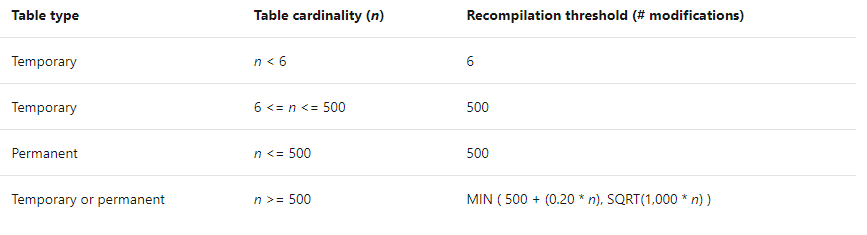
This changes from SQL Server 2016 and above as shown above. Using the same table of 10,000 rows, after around 3162 modifications, the table will have an UPDATE STATISTICS performed against it.
Asynchronous
Much like how data in an Availability group can be synchronous and asynchronous, updating statistics can also be done in this manner too.
This can be enabled by using the AUTO_UPDATE_STATISTICS_ASYNC option to specify whether statistics are to be updated synchronously or asynchronously.
When this is set to ‘ON’ the query optimiser will not wait for statistics to update before compiling a query. I must clarify that setting this option to ‘ON’ will not have any effect unless AUTO_UPDATE_STATISTICS is also set to ‘ON’. By default, the AUTO_UPDATE_STATISTICS_ASYNC option is set to ‘OFF’ and therefore the query optimiser will update statistics synchronously.
Think of it like trying to use your knife without sharpening it first.
So when will I ever use this?
This will enable faster plan generation however a sub-optimal query plan may be generated because the plan was compiled based off out-of-date statistics. Much like cooking, you can get started much quicker if you don’t sharpen your knife, however the process may take longer due to the bluntness and poorly cut ingredients may leave your customers unhappy.
It can however be beneficial if the statistics update will take a lot of time and you cannot afford to wait for the queries to complete. Another reason you may utilise this option is when statistics update is running in the background, but you need queries to be executed immediately without delay, hence this situation can be avoided by enabling AUTO_UPDATE_STATISTICS_ASYNC.
And there you have it! Some fundamentals of Statistics and how it can be comparatively similar to cooking! Let us know your thoughts down in the comments below!